17 December 2020: Database Analysis
Identification of Potential Biomarkers of Prognosis-Related Long Non-Coding RNA (lncRNA) in Pediatric Rhabdoid Tumor of the Kidney Based on ceRNA Networks
Xiongwei Wu1ABCEF, Jie Liu1BCD, Chengzhan Zhu2DF, Mingdi Ma1BF, Xin Chen1BCF, Yusheng Liu1BF, Nan Xia2BDE, Qian Dong12CDF*DOI: 10.12659/MSM.927725
Med Sci Monit 2020; 26:e927725


Abstract
BACKGROUND: Long non-coding RNA (lncRNA) can act as competing endogenous RNA (ceRNA) during tumor development. However, no study has elucidated the ceRNA network in pediatric rhabdoid tumor of the kidney (RTK) and its prognostic-related lncRNAs. The goal of the present study was to identify potential biomarkers of prognostic-related lncRNAs.
MATERIAL AND METHODS: RNA sequencing and clinical data were procured from the TARGET database. The “EdgeR” package was used to obtain differentially expressed lncRNA (DElncRNA), differentially expressed messenger RNAs (DEmRNA), and differentially expressed microRNAs (DEmiRNA). Cytoscape software was used to construct a ceRNA network. Gene Ontology (GO) and Kyoto Encyclopedia of Genes and Genomes (KEGG) enrichment analysis were conducted on the ceRNA network-related DEmRNA. The Kaplan-Meier method was used for predicting survival with ceRNA network-related DElncRNA. Univariate and multivariate Cox analyses were used to identify prognosis-related lncRNAs in the ceRNA network, and an RTK prognostic signature was constructed.
RESULTS: We identified 1109 DElncRNAs, 215 DEmiRNAs, and 3436 DEmRNAs; and 107 DElncRNAs, 21 DEmiRNAs, and 74 DEmRNAs were included in the ceRNA regulatory network. GO enrichment analysis and KEGG pathway enrichment indicated that the DEmRNAs were mainly related to the regulation of phospholipase C activity and the MAPK signaling pathway. Survival analysis showed that 9 of 107 DElncRNAs were correlated with prognosis (P<0.05). Univariate and multivariate Cox analysis identified 4 DElncRNAs (HNF1A-AS1, TPTEP1, SNHG6, and ZNF503-AS2) to establish a predictive model and can be used as independent prognostic biomarkers.
CONCLUSIONS: We constructed a ceRNA network that reveals potential lncRNA biomarkers for pediatric RTK.
Keywords: Biological Markers, Pediatrics, Rhabdoid Tumor, Biomarkers, Tumor, Child, Databases, Genetic, Kidney Neoplasms, Proportional Hazards Models, Repressor Proteins
Background
Rhabdoid tumors of the kidney (RTK) are rare but invasive renal tumors that occur in infancy and early childhood and account for approximately 1.3% of all renal tumors in children [1]. The majority of RTKs have SMARCB1 (SWI/SNF Related, Matrix Associated, Actin-Dependent Regulator of Chromatin, Subfamily B, Member 1, SMARCB1) double allele-inactivating mutations [2]. Patients with RTK generally have low survival rates, and recurrence, disease progression, and death usually occur early, making it the most lethal malignant solid tumor among children. Studies have reported that patients with RTK aged <6 months have a 2-year event-free survival (EFS) rate of 15%, while those >27 months have a 2-year EFS of 48% [3]. The main modalities of treatment currently include surgery, radiotherapy, and chemotherapy. However, it has been found that high-dose chemotherapy does not improve the prognosis of patients [4]. At present, there are few reports regarding the prognostic molecular markers of RTK. Therefore, we sought to identify some novel markers to screen RTK earlier and predict patient prognosis.
Long non-coding RNA (lncRNA) refers to a class of RNA molecules located in the nucleus and cytoplasm of cells widely found in eukaryotes, which form a complex regulatory network with target genes and are involved in the pathophysiological processes of the organism [5]. Recently, an increasing number of studies have discovered that lncRNA can be used as a diagnostic and prognostic marker for a variety of tumors, such as gastric cancer [6], liver cancer [7], and pancreatic cancer [8]. The competitive endogenous RNA (ceRNA) hypothesis [9] suggests that lncRNAs not only directly regulate the expression of target genes but also likely affect the number of miRNAs by adsorbing the core seed sequences of miRNAs to further affect the mRNA levels of target genes [10]. The ceRNA network is extensively involved in the regulation of vital activities such as inflammation, apoptosis, and differentiation in the body. However, little is known regarding the role of lncRNA and related ceRNA regulatory networks in RTK.
We downloaded the RNA expression profiles of PTK from the TARGET database for analysis and screened for differentially expressed RNAs. Through use of various bioinformatics software, the ceRNA network was constructed and many genes of potential research interest were identified.
Material and Methods
ACQUISITION OF TARGET PEDIATRIC RTK DATA:
The RNA sequencing data and corresponding clinical information of pediatric RTK were downloaded from the TARGET database (
CERNA NETWORK CONSTRUCTION:
In all, 107 DElncRNAs were used to predict targeted miRNAs by miRcode [11] (http://starbase.sysu.edu.cn/). The targeted miRNAs were further compared with DEmiRNAs; the intersected miRNAs were retained to develop the DElncRNAs-DEmiRNAs ceRNA network. Then, the DEmiRNAs in the DElncRNAs-DEmiRNAs ceRNA network were distributed via MiRTarBase [12] (http://mirtarbase.mbc.nctu.edu.tw), MiRDB [13] (http://www.mirdb.org/miRDB/), and TargetScan [14] (http://www.tar-getscan.org/) to predict miRNA-targeted mRNAs. The targeted mRNAs were further compared with DEmRNAs, and the intersected DEmRNAs were retained to develop the DEmiRNAs-DEmRNAs ceRNA network. Finally, Cytoscape (v3.8.0) [15] was used for constructing the ceRNA network.
FUNCTIONAL ENRICHMENT ANALYSIS:
GO enrichment and KEGG pathway enrichment analysis of the ceRNA network-related DEmRNA were achieved using R software with the “clusterProfiler” package, and the “enrichplot” package was used to draw related functional enrichment and pathway enrichment.
SURVIVAL ANALYSIS:
Survival curves and the Kaplan-Meier estimator for the ceRNA network-related DElncRNA were computed and plotted with the ‘survival’ package, and
UNIVARIATE AND MULTIVARIATE ANALYSES TO CONFIRM THE PROGNOSTIC-ASSOCIATED LNCRNA FACTORS IN RTK:
Based on the clinical information of RTK patients, univariate analysis was performed for survival-associated DElncRNAs in the ceRNA network using the log rank test. For survival-associated DElncRNAs with a
Results
DIFFERENTIALLY EXPRESSED RNAS IN PEDIATRIC RTK:
A total of 1109 lncRNAs were screened out, of which 421 were upregulated and 688 were downregulated. Of the 215 miRNAs, 170 were upregulated and 45 were downregulated. Of the 3436 differential mRNAs, 1607 were upregulated and 1829 were downregulated. Figure 1 shows the volcano maps and heat maps.
CONSTRUCTION OF CERNA NETWORKS AND GO AND KEGG ANALYSES:
We searched the 1109 DElncRNAs in the miRcode database. Then, 107 DElncRNAs and 21 DEmiRNAs were used to construct the 513 pairs in the DElncRNAs-DEmiRNAs network. Next, we predicted 21 DEmiRNAs in all 3 target-predicting databases; then, 21 DEmiRNAs and 74 DEmRNAs constructed 93 pairs of the DEmiRNA-DEmRNAs network. The lncRNA-miRNA-mRNA ceRNA network was visualized using Cytoscape software (Figure 2A). The GO and KEGG enrichment analyses were further used to display the biological function of the 74 ceRNA network-related DEmRNAs. The GO enrichment analysis showed that DEmRNAs were mostly related to the regulation of DNA-binding transcriptional activator activity, RNA polymerase II specificity, and phospholipase C activity (Figure 2B, Table 1). Further, KEGG enrichment analysis showed that the mRNAs were highly enriched in MAPK signaling pathway (Table 1).
SURVIVAL ANALYSIS AND ESTABLISHMENT OF THE CERNA NETWORK-RELATED DELNCRNAS PROGNOSTIC MODEL:
Survival analysis results showed that ADAMTS9-AS2, DSCR9, EMX2OS, HCG22, HNF1A-AS1, HOTAIR, SNHG6, TPTEP1, and ZNF503-AS2 were correlated with prognosis (P<0.05) (Figure 3). These significant survival-associated DElncRNAs were further submitted to univariate and multivariate Cox regression analyses to screen prognosis-related DElncRNAs for RTK. Subsequently, 6 lncRNAs were obtained after univariate Cox regression analysis by using P<0.05 (Table 2). All 6 lncRNAs underwent LASSO regression analysis (Figure 4A, 4B), and a prognostic model for prognostic-associated lncRNAs was constructed. The 4 prognostic-associated lncRNAs contained HNF1A-AS1, TPTEP1, and SNHG6, and ZNF503-AS2 (Figure 4C, Table 2). The model risk score was calculated as follows: risk score=(0.460038×exp_ HNF1A-AS1)+(0.249016×exp_ ZNF503-AS2)+(−1.557758×exp_) SNHG6)+(0.443621×exp_ TPTEP1), where HNF1A-AS1, TPTEP1, and ZNF503-AS2 were associated with high risk of death and SNHG6 is associated with low risk of death. The 4 prognostic-associated lncRNAs of the distribution of survival risk score (Figure 5A), survival time (Figure 5B), and expression heatmap (Figure 5C) revealed that the high-risk group was more likely to have a worse prognosis. According to the median risk score (median risk score=0.863512), pediatric RTK patients were divided into a low-group and high-risk group. Survival analysis revealed that the low-risk group was had a better prognosis (P<0.0001, Figure 5D). The ROC curves for the 4 lncRNAs in the signature had area under the curve values >0.5 (Figure 5E, 5F). These findings suggested that the 4 identified lncRNAs may serve as meaningful prognostic markers.
Discussion
RTK is a highly malignant and aggressive tumor, and, unfortunately, the overall prognosis for RTK is still only about 20–25% [3]. Therefore, accurate prediction of prognosis is essential for the personalized treatment of these patients. We sought to find novel biomarkers to diagnose RTK earlier and predict the prognosis of patients. We screened our 4 prognosis-associated lncRNAs based on a ceRNA network combined with clinical information of patients to identify prognostic biomarkers of RTK.
At present, the ceRNA hypothesis suggests that lncRNA can competitively bind to miRNA and act as an “miRNA sponge” to indirectly regulate the downstream target genes of the miRNA [9]. A growing body of evidence suggests that lncRNAs can serve as molecular biomarkers in multiple cancer types to predict patient prognosis. However, thus far, there have been very few reports on the ceRNA network related to pediatric RTK. Ren et al. obtained 109 samples of rhabdoid tumor through the GEO database, including 31 rhabdoid tumor and 21 normal kidneys, and through use of the co-expression method, they finally identified RPL5 and RPL10 as potential diagnostic markers for AT/RT [16]. Their research provides an idea for the diagnosis of rhabdoid tumor. However, due to the lack of clinical survival information of patients, the markers they screened cannot be judged to predict prognosis. In our research, we downloaded RNA-seq data from the TARGET database, which is a database with complete clinical information and sequencing information, and we constructed a ceRNA network containing 107 DElncRNAs, 21 DEmiRNAs, and 78 DEmRNAs. To screen out prognosis-related lncRNAs, we conducted survival analysis on 107 DElncRNAs in the ceRNA network and found that 9 were related to survival. These significant survival-associated DElncRNAs were further submitted to univariate and multivariate Cox regression analyses to screen prognosis-related lncRNAs for RTK. Finally, 4 prognosis-related lncRNAs (HNF1A-AS1, TPTEP1, SNHG6, and ZNF503-AS2) were used to establish a prognostic model. The 3- and 5-year survival probability areas under the ROC curves were 0.93 and 0.889, respectively, which fully explained the accuracy of the lncRNA prognostic models.
To study the function of the ceRNA network, we performed KEGG and GO enrichment analysis on DEmRNAs in ceRNA, which are mainly enriched in the MAPK signaling pathway. In cancer, the constitutively active MAPK signaling pathway often leads to promotion of abnormal cell growth and tumorigenesis [17] such as liver cancer [18] and gastric cancer [19]. In colon cancer, HNF1A-AS1 upregulates OTX1 to activate the ERK/MAPK pathway [20]. Among the 4 prognostic-associated lncRNAs found in our study, HNF1A-AS1 was enriched in the MAPK signaling pathway. Therefore, we predicted that HNF1A-AS1 can promote the development of RTK by activating the ERK/MAPK pathway. The high expression of TPTEP1 can predict the prolonged overall survival of patients with lung cancer [21]. TPTEP1 overexpression suppressed cell proliferation and metastasis but did not affect cell apoptosis in hepatocellular carcinoma [22]. However, in our study, the survival rate of patients with TPTEP1 overexpression was low, which likely means that in RTK, TPTEP1 overexpression can promote tumor development, which needs to be further confirmed in future studies. Overexpression of SNHG6 is related to tumor progression and poor prognosis. In rectal cancer, SNHG6 promotes the migration, invasion, and epithelial-mesenchymal transition of colorectal cancer cells through the miR-26a/EZH2 axis [23]. SNHG6 is overexpressed in childhood Wilms’ tumors, and SNHG6 knockout can inhibit proliferation, migration, and invasion [24]. Our study found that patients with high SNHG6 expression have a lower survival rate. It is possible that in patients with RTK, high SNHG6 expression can inhibit tumor growth. ZNF503 is involved in the development of tumors. In hepatocellular carcinoma, ZNF503 promotes migration, invasion, and epithelial-mesenchymal transition (EMT) processes by regulating GATA3 expression [25]. However, very few studies have focused on the relationships among HNF1A-AS1, TPTEP1, SNHG6, and ZNF503-AS2 in RTK. Therefore, we need further experimental research to clarify the molecular mechanism and biological functions of these prognostic-related lncRNAs in RTK.
Our study has some limitations. First, our clinical sample size was not large enough. Second, we were able to predict the relationship between lncRNA and miRNA and between miRNA and mRNA only through online databases; hence, further experimental research should be conducted to address this issue. Last, the 4 prognostic-related lncRNAs selected in this study did not perform any biological functions. However, the strength of our research lies in being one of the first studies to predict the molecular mechanism of RTK from the perspective of the ceRNA network, and at the same time screen out 4 lncRNA prognostic biomarkers based on the ceRNA network combined with clinical prognostic information. This likely provides new ideas for RTK research.
Conclusions
In conclusion, we identified 4 lncRNAs related to RTK patient prognosis that can be used as candidate biomarkers and therapeutic targets. Further large-scale studies are required to validate and strengthen our findings.
Figures
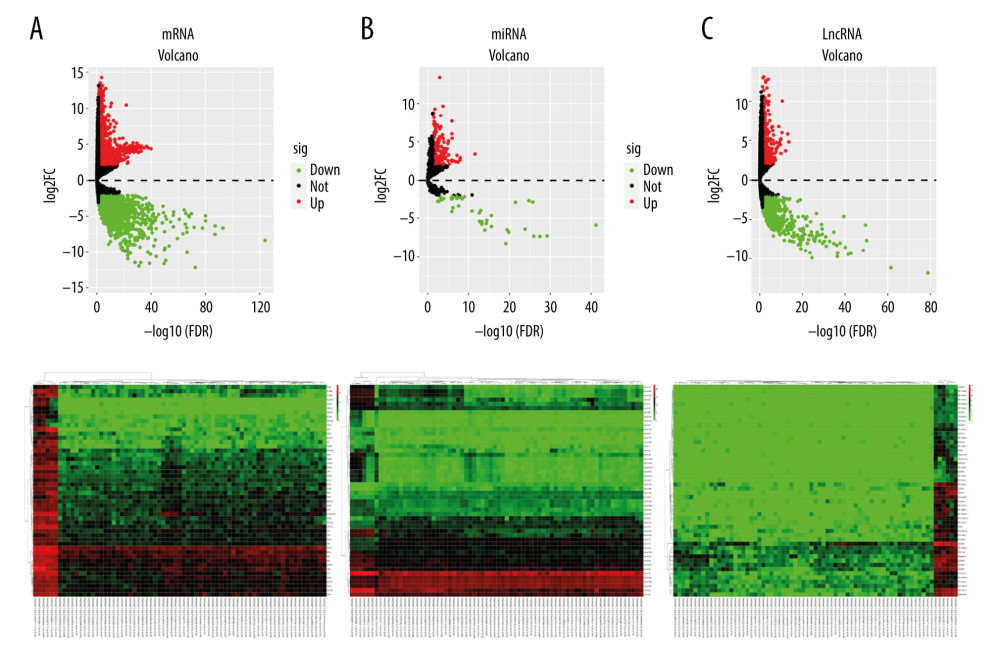 Figure 1. Heat map and volcano map of differential gene expression in rhabdoid tumor of the kidney (RTK). The colors from green to red indicate the trend from low to high expression, respectively. (A) lncRNA, (B) miRNA, (C) mRNA.
 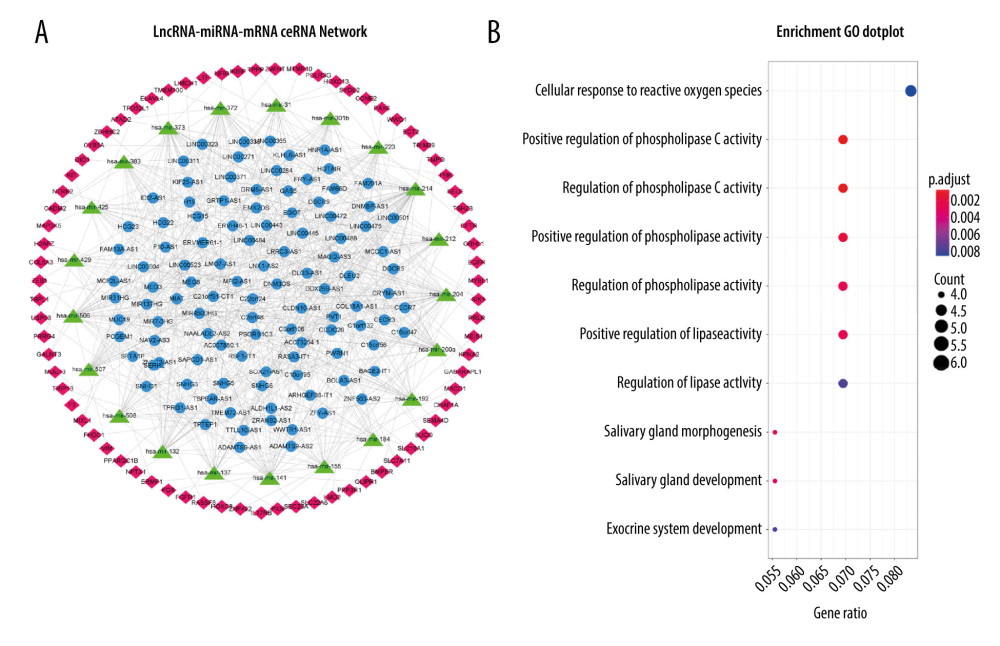 Figure 2. (A) The lncRNA-miRNA-mRNA ceRNA network, with mRNA in red, miRNA in green, and lncRNA in blue. (B) GO functional enrichment analysis results.
 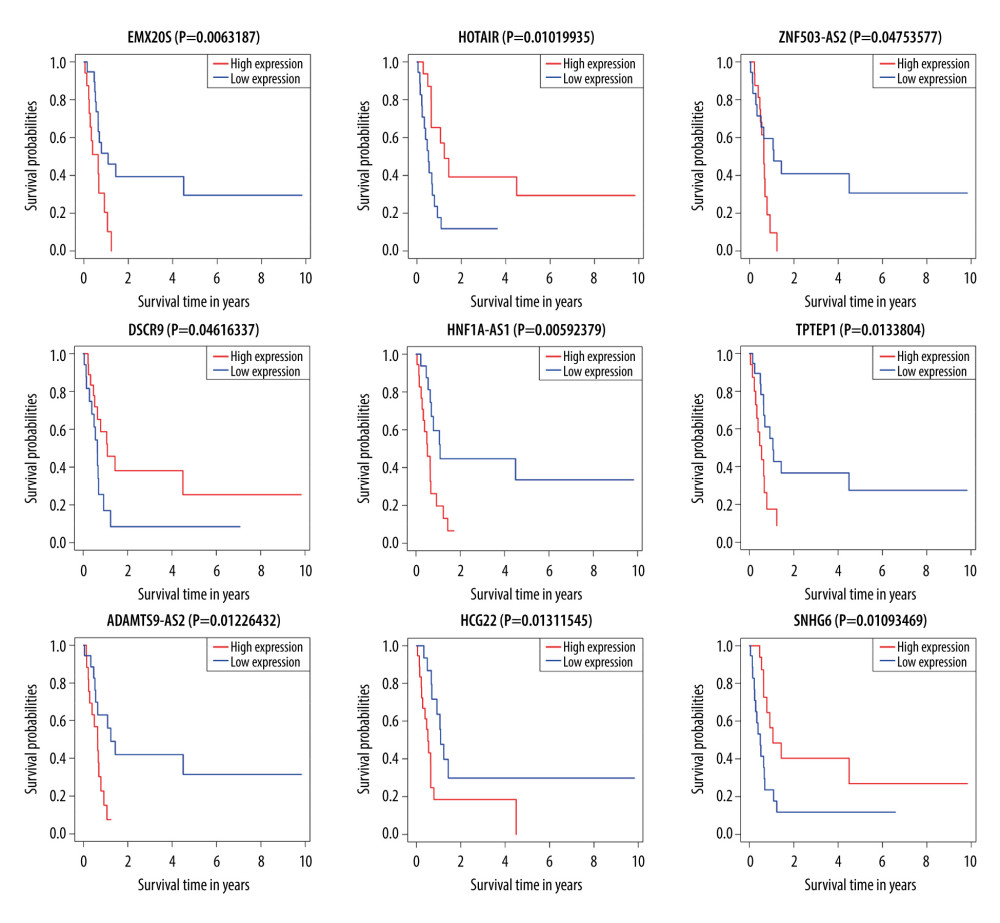 Figure 3. Kaplan-Meier curves of lncRNA correlation with OS in the RTK ceRNA network; red lines represent high expression and blue lines represent low expression.
 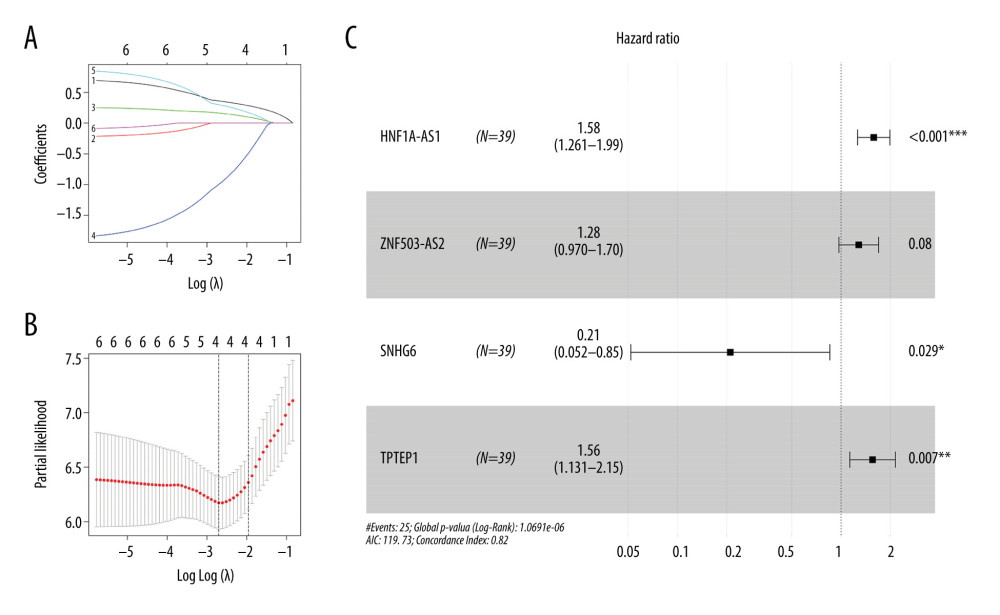 Figure 4. (A, B) Distribution of the minimum absolute contraction and LASSO coefficients for the 6 DElncRNAs selected in univariate Cox regression analysis. (C) Forest plot of selected key lncRNAs. The first column of the forest plot indicates the gene name, the second column indicates the number of samples included, the third column shows the OR point and the upper and lower 95% CI of the estimated OR, the fourth column shows the OR (95% CI), and the fifth column represents the P value, with P<0.05 considered statistically significant, and more * represents stronger prognostic correlation.
 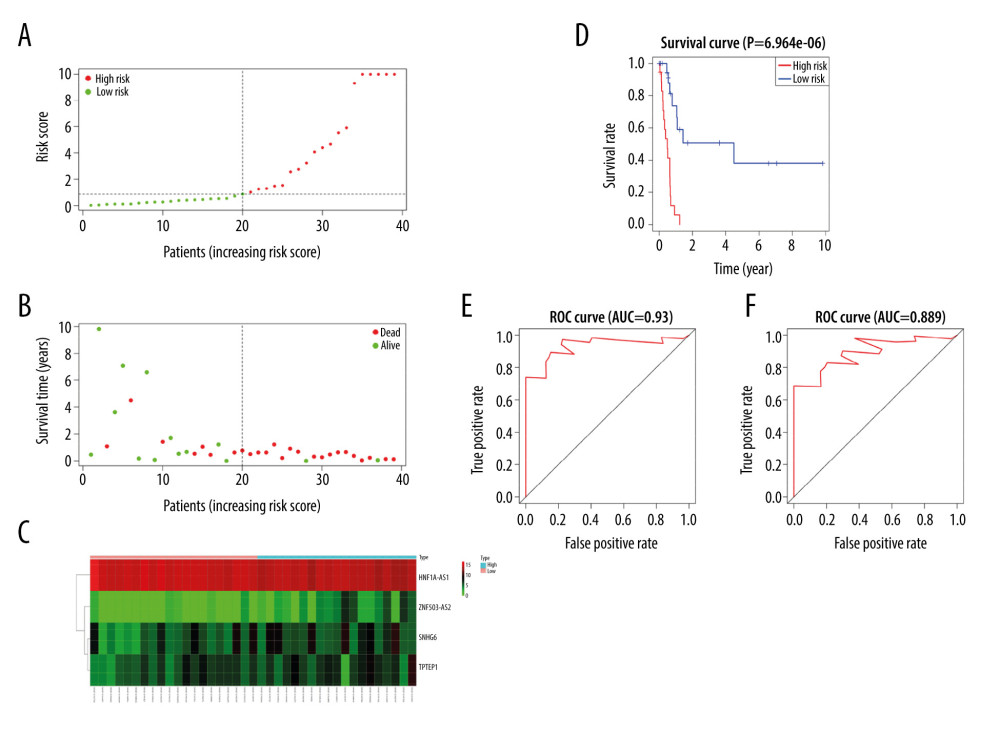 Figure 5. (A) Risk score distributions of the 4 lncRNAs. (B) Overall survival of all RTK patients. (C) Expressions heat maps of the 4 lncRNAs in the low- and high-risk groups. (D) Kaplan-Meier survival curves for high- and low-risk RTK patients; red and blue lines represent high and low expression, respectively. (E, F) ROC curves for the lncRNA-constructed Cox risk regression model predicting the 3- and 5-year survival probability of RTK patients.
 References
1. Reinhard H, Reinert J, Beier R, Rhabdoid tumors in children: Prognostic factors in 70 patients diagnosed in Germany: Oncol Rep, 2008; 19(3); 819-23
2. Jackson EM, Sievert AJ, Gai X, Genomic analysis using high-density single nucleotide polymorphism-based oligonucleotide arrays and multiplex ligation-dependent probe amplification provides a comprehensive analysis of INI1/SMARCB1 in malignant rhabdoid tumors: Clin Cancer Res, 2009; 15(6); 1923-30
3. van den Heuvel-Eibrink MM, van Tinteren H, Rehorst H, Malignant rhabdoid tumours of the kidney (MRTKs), registered on recent SIOP protocols from 1993 to 2005: a report of the SIOP renal tumour study group: Pediatr Blood Cancer, 2011; 56(5); 733-37
4. Furtwangler R, Kager L, Melchior P, High-dose treatment for malignant rhabdoid tumor of the kidney: No evidence for improved survival-The Gesellschaft fur Padiatrische Onkologie und Hamatologie (GPOH) experience: Pediatr Blood Cancer, 2018; 65(1); 26746
5. Kopp F, Mendell JT, Functional classification and experimental dissection of long noncoding RNAs: Cell, 2018; 172(3); 393-407
6. Fattahi S, Kosari-Monfared M, Golpour M, LncRNAs as potential diagnostic and prognostic biomarkers in gastric cancer: A novel approach to personalized medicine: J Cell Physiol, 2020; 235(4); 3189-206
7. Kamel MM, Matboli M, Sallam M, Investigation of long noncoding RNAs expression profile as potential serum biomarkers in patients with hepatocellular carcinoma: Transl Res, 2016; 168; 134-45
8. Wang J, Xiang J, Li X, Construction of a competitive endogenous RNA network for pancreatic adenocarcinoma based on weighted gene co-expression network analysis and a prognosis model: Front Bioeng Biotechnol, 2020; 8; 515
9. Salmena L, Poliseno L, Tay Y, A ceRNA hypothesis: The Rosetta Stone of a hidden RNA language?: Cell, 2011; 146(3); 353-58
10. Karreth FA, Pandolfi PP, ceRNA cross-talk in cancer: When ce-bling rivalries go awry: Cancer Discov, 2013; 3(10); 1113-21
11. Jeggari A, Marks DS, Larsson E, miRcode: A map of putative microRNA target sites in the long non-coding transcriptome: Bioinformatics, 2012; 28(15); 2062-63
12. Chou CH, Shrestha S, Yang CD, miRTarBase update 2018: A resource for experimentally validated microRNA-target interactions: Nucleic Acids Res, 2018; 46(D1); D296-302
13. Wong N, Wang X, miRDB: An online resource for microRNA target prediction and functional annotations: Nucleic Acids Res, 2015; 43(Database issue); D146-52
14. Park K, Kim KB, miRTar Hunter: A prediction system for identifying human microRNA target sites: Mol Cells, 2013; 35(3); 195-201
15. Shannon P, Markiel A, Ozier O, Cytoscape: A software environment for integrated models of biomolecular interaction networks: Genome Res, 2003; 13(11); 2498-504
16. Ren Y, Tao C, Wang X, Ju Y, Identification of RPL5 and RPL10 as novel diagnostic biomarkers of Atypical teratoid/rhabdoid tumors: Cancer Cell Int, 2018; 18; 190
17. Zuo X, Li B, Zhu C, Stoichiogenomics reveal oxygen usage bias, key proteins and pathways associated with stomach cancer: Sci Rep, 2019; 9(1); 11344
18. Braeuning A, Schwarz M, Regulation of expression of drug-metabolizing enzymes by oncogenic signaling pathways in liver tumors: A review: Acta Pharm Sin B, 2020; 10(1); 113-22
19. Magnelli L, Schiavone N, Staderini F, MAP kinases pathways in gastric cancer: Int J Mol Sci, 2020; 21(8); 2893
20. Wu J, Meng X, Jia Y, Long non-coding RNA HNF1A-AS1 upregulates OTX1 to enhance angiogenesis in colon cancer via the binding of transcription factor PBX3: Exp Cell Res, 2020; 393(2); 112025
21. Cao F, Wang Z, Feng Y, lncRNA TPTEP1 competitively sponges miR3285p to inhibit the proliferation of nonsmall cell lung cancer cells: Oncol Rep, 2020; 43(5); 1606-18
22. Ding H, Zhang X, Su Y, GNAS promotes inflammation-related hepatocellular carcinoma progression by promoting STAT3 activation: Cell Mol Biol Lett, 2020; 25; 8
23. Zhang M, Duan W, Sun W, LncRNA SNHG6 promotes the migration, invasion, and epithelial-mesenchymal transition of colorectal cancer cells by miR-26a/EZH2 axis: Onco Targets Ther, 2019; 12; 3349-60
24. Su L, Wu A, Zhang W, Kong X, Silencing long non-coding RNA SNHG6 restrains proliferation, migration and invasion of Wilms’ tumour cell lines by regulating miR-15a: Artif Cells Nanomed Biotechnol, 2019; 47(1); 2670-77
25. Yin G, Liu Z, Wang Y, ZNF503 accelerates aggressiveness of hepatocellular carcinoma cells by down-regulation of GATA3 expression and regulated by microRNA-495: Am J Transl Res, 2019; 11(6); 3426-37
Figures
Figure 1. Heat map and volcano map of differential gene expression in rhabdoid tumor of the kidney (RTK). The colors from green to red indicate the trend from low to high expression, respectively. (A) lncRNA, (B) miRNA, (C) mRNA.Figure 2. (A) The lncRNA-miRNA-mRNA ceRNA network, with mRNA in red, miRNA in green, and lncRNA in blue. (B) GO functional enrichment analysis results.Figure 3. Kaplan-Meier curves of lncRNA correlation with OS in the RTK ceRNA network; red lines represent high expression and blue lines represent low expression.Figure 4. (A, B) Distribution of the minimum absolute contraction and LASSO coefficients for the 6 DElncRNAs selected in univariate Cox regression analysis. (C) Forest plot of selected key lncRNAs. The first column of the forest plot indicates the gene name, the second column indicates the number of samples included, the third column shows the OR point and the upper and lower 95% CI of the estimated OR, the fourth column shows the OR (95% CI), and the fifth column represents the P value, with P<0.05 considered statistically significant, and more * represents stronger prognostic correlation.Figure 5. (A) Risk score distributions of the 4 lncRNAs. (B) Overall survival of all RTK patients. (C) Expressions heat maps of the 4 lncRNAs in the low- and high-risk groups. (D) Kaplan-Meier survival curves for high- and low-risk RTK patients; red and blue lines represent high and low expression, respectively. (E, F) ROC curves for the lncRNA-constructed Cox risk regression model predicting the 3- and 5-year survival probability of RTK patients. Tables
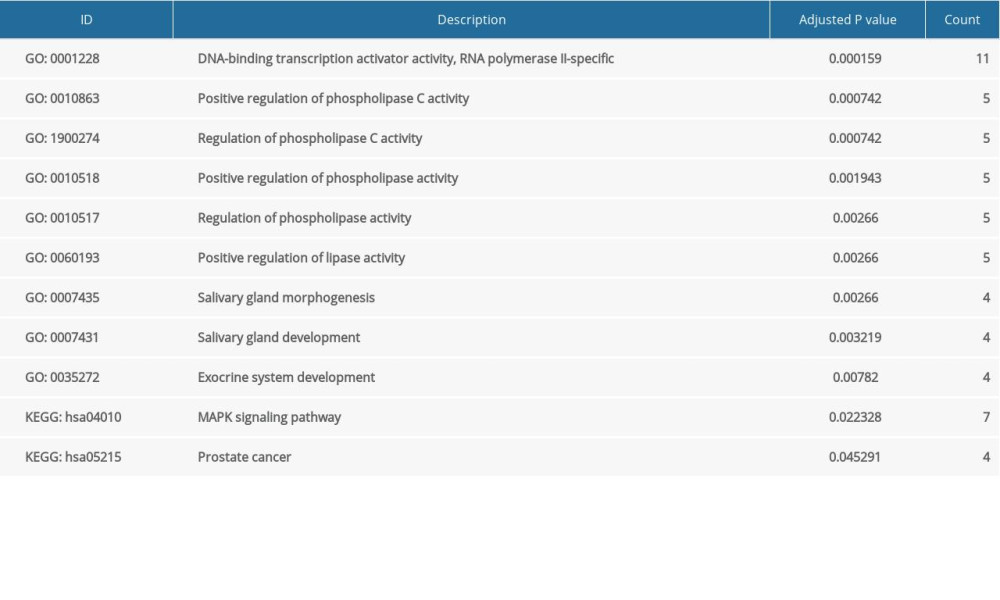 Table 1. GO enrichment analysis (top 10) and KEGG pathways (top 5) of the DEmRNAs.
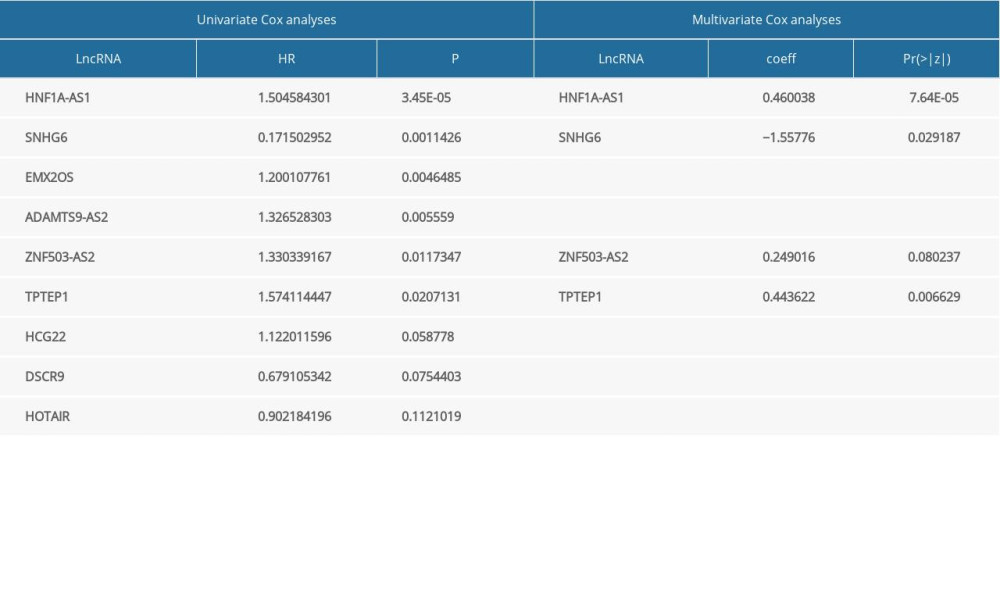 Table 2. Univariate and multivariate Cox analysis of overall survival.Table 1. GO enrichment analysis (top 10) and KEGG pathways (top 5) of the DEmRNAs.Table 2. Univariate and multivariate Cox analysis of overall survival.
 In Press
06 Mar 2024 : Clinical Research
Comparison of Outcomes between Single-Level and Double-Level Corpectomy in Thoracolumbar Reconstruction: A ...Med Sci Monit In Press; DOI: 10.12659/MSM.943797
21 Mar 2024 : Meta-Analysis
Economic Evaluation of COVID-19 Screening Tests and Surveillance Strategies in Low-Income, Middle-Income, a...Med Sci Monit In Press; DOI: 10.12659/MSM.943863
10 Apr 2024 : Clinical Research
Predicting Acute Cardiovascular Complications in COVID-19: Insights from a Specialized Cardiac Referral Dep...Med Sci Monit In Press; DOI: 10.12659/MSM.942612
06 Mar 2024 : Clinical Research
Enhanced Surgical Outcomes of Popliteal Cyst Excision: A Retrospective Study Comparing Arthroscopic Debride...Med Sci Monit In Press; DOI: 10.12659/MSM.941102
Most Viewed Current Articles
17 Jan 2024 : Review article
Vaccination Guidelines for Pregnant Women: Addressing COVID-19 and the Omicron VariantDOI :10.12659/MSM.942799
Med Sci Monit 2024; 30:e942799
14 Dec 2022 : Clinical Research
Prevalence and Variability of Allergen-Specific Immunoglobulin E in Patients with Elevated Tryptase LevelsDOI :10.12659/MSM.937990
Med Sci Monit 2022; 28:e937990
16 May 2023 : Clinical Research
Electrophysiological Testing for an Auditory Processing Disorder and Reading Performance in 54 School Stude...DOI :10.12659/MSM.940387
Med Sci Monit 2023; 29:e940387
01 Jan 2022 : Editorial
Editorial: Current Status of Oral Antiviral Drug Treatments for SARS-CoV-2 Infection in Non-Hospitalized Pa...DOI :10.12659/MSM.935952
Med Sci Monit 2022; 28:e935952