04 February 2021: Clinical Research
Efficacy of Endoscopic Ultrasound Elastography in Differential Diagnosis of Gastrointestinal Stromal Tumor Versus Gastrointestinal Leiomyoma
Jinlu Guo1ACDEF, Tao Bai1ABDEF, Zhen Ding1AD, Fan Du1ACDE*, Shi Liu1ADEDOI: 10.12659/MSM.927619
Med Sci Monit 2021; 27:e927619


Abstract
BACKGROUND: The diagnostic efficacy of endoscopic ultrasound (EUS) elastography for alimentary tract diseases remains uncertain. The aim of this study was to evaluate the utility of EUS elastography in differential diagnosis between the 2 most common subepithelium tumors of the digestive tract – gastrointestinal stromal tumors (GISTs) and gastrointestinal leiomyomas (GILs) – which cannot be differentiated by conventional EUS imaging.
MATERIAL AND METHODS: Electronic records were retrospectively reviewed from Jan 2015 to Jul 2019. Patients accepting EUS elastography with histopathological diagnosis of GISTs or GILs were included. The images of EUS elastography were analyzed by hue histogram in Photoshop. Hue values of RGB, R, G, and B channels of each group were acquired. We used the t test, ROC curve analysis, and binary logistic regression analysis for data post-processing.
RESULTS: We included 47 patients with GISTs and 14 with GILs. The mean±standard deviations (SD) of hue values were 20.25±0.72, –0.79±0.78, 20.79±1.68, 39.72±1.30 for GISTs and 20.80±0.46, 1.80±1.05, 28.39±2.15, and 31.95±2.60 for GILs of RGB, R, G, and B channels, respectively. The t test showed statistically significant differences in mean hue values between GISTs and GILs in B and G channels, but not in RGB and R channels. The area under the ROC curve combining B and G values was 0.723. Binary logistic regression analysis suggested no statistically significant difference in ability to differentiate between GISTs and GILs with B and G values (P>0.05).
CONCLUSIONS: There was insufficient evidence to support the application of quantitative EUS elastography for differential diagnosis of GISTs and GILs in this study.
Keywords: Diagnosis, Differential, Elasticity Imaging Techniques, gastrointestinal stromal tumors, Leiomyoma, Endoscopy, Gastrointestinal, Endosonography, Gastrointestinal tract, ROC Curve
Background
GISTs and GILs account for the majority of subepithelium tumors in the gastrointestinal tract [1] and they are both common incidentally found tumors, as they are always asymptomatic [2]. Considering their dramatically different prognoses (GISTs tend to be malignant, while GILs are benign) [3,4], differential diagnosis of GISTs vs GILs is very important. However, conventional EUS does not perform well in this differential diagnosis. As opposed to epithelial diseases, which are easier to diagnose because they are superficial, obvious, and operable, subepithelium lesions are deep and tissue biopsy involves a greater risk of perforation, hemorrhage, and thromboembolism of the digestive tract [5]. There is also a high rate of false-negative results [6] and a low but important morbidity rate [7]. A novel, effective, and non-invasive technique, EUS elastography, appears to have potential utility in this differential diagnosis.
EUS is a technique combining endoscopy and ultrasound to diagnose digestive diseases, including subepithelium lesions, but the differential diagnosis of malignant vs benign diseases is still challenging. Elastography was selected and developed for use in differential diagnosis due to its feasibility and non-invasiveness [8,9]. The cardinal principle of elasticity imaging is that tissues with different elasticity will produce different strains when we use the external strength to compress them or just with normal breathing and blood circulation. Then, the software algorithm embedded in an ultrasonic system can characterize these strain values and visualize them in real time [10]. With the development and refinement of elastography, it has been widely applied in clinical practice of diagnosis and differential diagnosis, especially in liver, thyroid, kidney, lymph nodes, mammary gland, and prostate diseases [11,12]. Lesions in deep sites, such as pancreatic and gastrointestinal foci, are difficult to diagnose. Generally, tumors are harder than normal tissues, so in recent years there has been increased use of EUS elastography as a result of gastrointestinal endoscopists’ efforts [13] and the combination of EUS and elastography, and much progress has been made in diagnosis and differential diagnosis of digestive diseases, including deep lesions. In addition, semi-quantitative and quantitative analysis of EUS elastography are increasingly used to reduce the impact of endoscopists’ subjective interpretations of conventional EUS images and qualitative judgements.
Many studies have evaluated the efficacy and utility of the technique in clinical practice, especially in pancreatic and lymph node diseases [11,14–19]. To date, however, relatively few studies have focused on the alimentary tract, although EUS elastography has long been used in the diagnosis of diseases in this field [8,13,20]. Results of previous studies are controversial. Kim et al [21] evaluated EUS elastography and found good differential diagnostic value, with sensitivity of 100% and specificity of 94% for GISTs and GILs. However, Ignee et al [22] found that EUS elastography is not be helpful for differential diagnosis of GISTs vs GILs. Therefore, the present study was designed to quantitatively reevaluate the utility of EUS elastography in differential diagnosis between GISTs and GILs, using hue histogram analysis as the foundation of histopathological diagnosis (surgery or biopsy) as the criterion standard. Our results may add to the knowledge base used to choose the most appropriate method for use in clinical practice.
Material and Methods
PATIENTS:
This study was approved by the Institutional Ethics Review Committee of Huazhong University of Science and Technology, China. All patients were informed and signed the informed consent. This retrospective study reviewed the electronic records of patients who received EUS elastography in the Digestive Endoscopy Center of Wuhan Union Hospital from Jan 2015 to Jul 2019. Patients accepting EUS elastography with histopathological diagnosis of GISTs and GILs were included. Subjects who met any of the following criteria were excluded: 1) Diagnosis of EUS-E did not involve subepithelium lesions in the gastrointestinal tract or parenteral diseases; 2) EUS elastography images were lost or unqualified; 3) Cystic and necrotic areas were eliminated, as they easily alter the strain of the region of interest (ROI) we selected [7]; 4) Patients without histopathological diagnosis or samples of histopathology were off-specification to diagnosis; and 5) Histopathology diagnoses were not GISTs or GILs. Every patient was checked by expert endoscopists who were blinded to the patients’ clinical history and the aim of the study. We enrolled 61 patients. Figure 1 contains a study flow chart.
EUS ELASTOGRAPHY:
In the process of inspection, an endoscopist blinded to patient history and study aim used a B-mode probe to observe the digestive tract. Five layers of gastrointestinal tract were presented on 2-dimensional grayscale images (Figure 2A). The endoscopist explored the lesions on B-mode images, then used the probe at a mean frequency of 7.5 MHz for transmission/reception without using ultrasonic contrast agents or tissue harmonic imaging to compress the lesions, thus assessing the elasticity of the compressed tissues. Finally, the elasticity values were visually expressed in different colors on the elastography images (blue for hard tissue, green for intermediate tissue, and red for soft tissue) on the basis of tissue deformation [17,23] (Figure 2A). Dynamic observation was required at the beginning, then the endoscopist took at least 3 standard EUS elastography images according to information acquired in the process. Subsequent analysis was performed using the off-line saved images.
HUE HISTOGRAM ANALYSIS:
Hue histograms are widely used to quantify EUS elastography images [17,23–25] and are used to describe the distribution of different colors in a picture. The main principle is the RGB color model. There are 256 (range, 0–255; a higher number indicates stronger color) gradients in the R, G, B, and RGB channels, and these gradients are listed in ascending order. Every RGB gradient consists of specific R, G, and B gradients. When using a hue histogram to analyze a picture, we can get 4 channels of RGB, R, G, and B, as well as their mean hue values (Figure 2B), which quantitatively indicate tissue elasticity.
Every image we obtained showed (Figure 3) 2 same-size pictures, both containing gastrointestinal lesions. The left side was a conventional B-mode image and the right side was an EUS elastography image, which was superimposed by red, green, and blue colors. The pathologic diagnosis (surgery or biopsy) was regarded as the criterion standard. The analysis of EUS elastography images was blinded to all other clinical characteristics and patient diagnosis by numbering the images selected with random numbers by another researcher. The analyzer selected the ROI of the EUS elastography images, which contained the whole area of the lesions with dotted lines shown in the images (Figure 3). Adobe Photoshop CC software was used to conduct hue histogram analysis of the ROI. The mean hue values of conventional B-mode images were obtained in the same way and we subtracted them from the corresponding color value in EUS elastography images to adjust for differences in ultrasound gain [23].
STATISTICAL ANALYSIS:
Patient age is reported as mean±SD. Sex (male/female) was recorded as a number. The hue values of RGB, R, G, and B were reported as mean±SD. We used the
Results
We included 47 patients with GISTs and 14 with GILs (Table 1). The GIST group consisted of 23 males and 24 females, with a mean age of 55.6±7.8 years. The GIL group consisted of 8 males and 3 females, with a mean age of 48.1±12.7 years. The
The
Discussion
Compared to qualitative analysis of EUS elastography, which is carried out with a rough scoring system and has somewhat improved the validity and reproducibility of results [26], hue histogram analysis is more objective, even when used by less-experienced doctors [5,23,25], and it can quantify what is seen in a more scientific way, so as to provide more reliable statistics. Many studies [15,16,19] have used strain ratio as another quantitative method of EUS elastography. The strain ratio is B/A (A is the strain of a representative area of diseased lesion, and B is the strain of an area of soft-tissue reference area) [27]. The muscularis propria and muscularis mucosa are too thin to select as reference areas, and strain ratio values can be influenced by position of reference areas [28]. So even if we select them, it is difficult to measure the exact strain ratio values, but hue histogram analysis can avoid these disadvantages and make better use of the information contained in EUS elastography images [24]. We used double-blinding in our study to reduce bias in data acquisition, image selection, and statistical analysis. We used strict operation rules to ensure the reliability, accuracy, and stability of the results of EUS elastography. Patients in every risk grade of GISTs were basically balanced, which guaranteed the representativeness of samples to reflect clinical practice, and the unbalanced distribution of GISTs and GILs in our study also parallels the real clinical situation [24].
In our study, the differences in mean hue values between GISTs and GILs had statistical significance in B and G channels, while differences in RGB and R channels were not significant. It was not difficult to understand why there was no statistically significant difference in the RGB channel, while B and G channels were the opposite. The RGB channel is comprised of R, G, and B channels, and every channel has 256 gradients, so every pixel of the RGB channel is composed of 3 gradients of R, G, and B channels, respectively. Some images whose B values were lower and G values were higher or vice versa may have the same or similar RGB values.
G values were higher in the GIL group and B values were higher in the GIST group, so further ROC curve analyses with and without combining G and B values were conducted. The results suggest the possibility of using EUS elastography for differential diagnosis between GISTs and GILs. However, the sample size was limited in the GIL group, and binary logistic regression analysis showed no significance (
First, most published studies found statistically significant differences between GISTs and the other submucosal tumors, including GILs, in the alimentary tract [5,29]. Very few studies directly compared GISTs and GILs. A recent study [21] showed that EUS elastography had good differential diagnostic value between GISTs and GILs, with specificity of 94% and sensitivity of 100%. Although they used strain ratio as a quantitative method, they did not use the strain value of normal tissue of the gastrointestinal tract wall, but rather used the water in the EUS scope balloon as the reference area. This may be an alternative quantitative method of EUS elastography in gastrointestinal tract research. Self-tissue selected as a reference is needed in strain ratio analysis [5,30], and different physical characteristics of tissues in individuals might also have influenced the results [17], while the balloon as reference was coessential in the above-mentioned study. Another point is that its sample size was small, which may have influenced the results. Second, GISTs and GILs both originate from gastrointestinal mesenchymal tissue [26], and when the methods of histopathology were not fully developed, GISTs were regarded as leiomyomas [8,31]. This suggests that their basic characteristics of pathophysiology and their elasticity are similar. Third, hue histogram analysis was used in our study because it provides more complete information from images. We further applied binary logistic regression analysis in this study, not just the t test and ROC curve analysis. All of the above strengths enhance the scientific rigor and credibility of our results. Finally, data obtained from different areas and races may differ. Thus, histopathology, including surgery and EUS-FNA/FNB, may remain the main differential diagnostic method for GISTs and GILs. EUS-FNB may be the first-line modality, as it causes less injury than surgery and has higher accuracy than EUS-FNA [6]. There were several limitations to our study. First, selection bias was inevitable. Second, although hue histogram analysis can provide more reliable data, it requires more time and resources [23]. Third, some factors are difficult to eliminate in EUS elastography, such as breathing artifacts and the relatively low depth of penetration [30]. Fourth, interobserver variation in our study was inevitable due to its retrospective nature [20].
Conclusions
There was insufficient evidence to support the use of EUS elastography in differential diagnosis of GISTs and GILs. More powerful data are needed to determine the utility of EUS elastography in differentiating these 2 diseases.
Figures
 Figure 1. Selection process and distributions of the diseases among the patients (flow chart). In the process, EUS elastography images and histopathologic results of subjects included in the study were acquired from the system and sent to the designated computer for further analysis by researcher A. Next, researcher B selected qualified images from included subjects’ EUS elastography images and numbered all qualified images with random numbers. Hue histogram analysis of numbered images and statistical analysis were carried out by researcher C and researcher D, respectively. Among the researchers, B, C, and D were blinded to patient history and the aim of the study.
 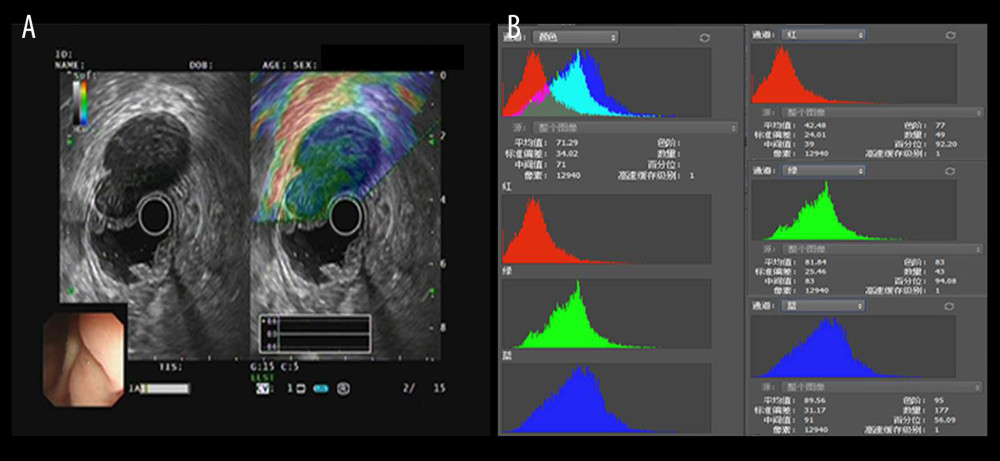 Figure 2. The introduction of EUS elastography image (A) and hue mean histogram (B). The image shows the EUS and EUS elastography of a patient with gastrointestinal stromal tumor in stomach. Figure A the left part is an EUS image, on which we can see 5 layers of the gastric tract wall, lined mucosa, muscularis mucosa, submucosa, muscularis propria, and serosa from inside to outside, and the focus sited in the layer of muscularis propria. Figure A the right part is an EUS elastography image, which is superimposed by colors of blue (hard tissues), green (intermedium tissues), and red (soft tissues) according to different elasticity produced by different tissues. The bottom-left corner is the appearance of electronic endoscopy. Figure B this picture shows the mean hue histogram of an area we selected (ROI). There were 4 channels: the front-most is the RGB channel, which was mixed by following 3 channels of R channel, G channel, and B channel. Each image shows the mean value and SEM; for example, 71.29 and 34.02 of RGB channel in this picture. Simultaneously, we obtained mean values of separated channels of R, G, and B respectively.
 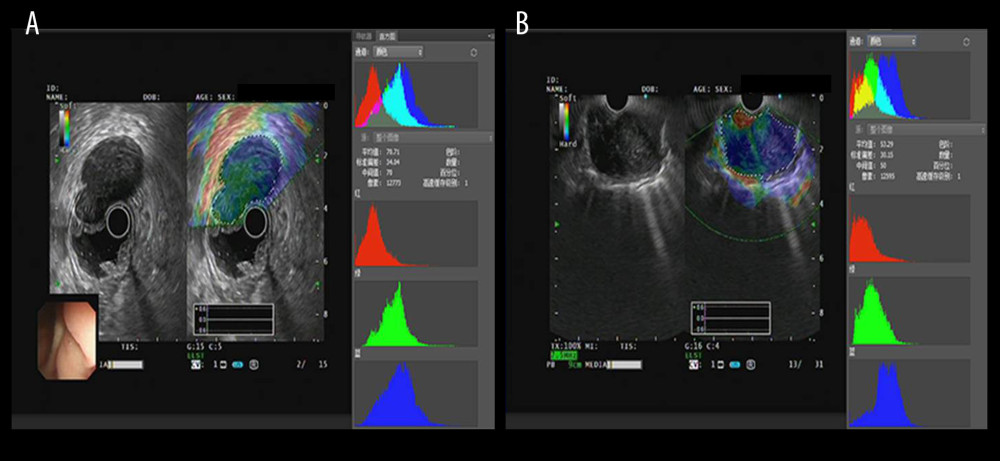 Figure 3. The EUS elastography images of GIST (A) and GIL (B). The pictures were print-screened from Photoshop CC in the process of hue histogram analysis. We obtained Figure A from a patient with GIST and Figure B from a patient with GIL by use of the elastography system in our hospital. In these pictures, the left side shows EUS and EUS elastography images and the right side shows the hue histogram of the region of interest (ROI), circled by a dotted line in the left side as the picture. There are 4 channels – RGB, R, G, and B – in the hue histogram and mean hue histogram values, and their standard deviations were calculated as 70.71±30.34 (A) and 53.29±30.15 (B) in the RGB channel.
 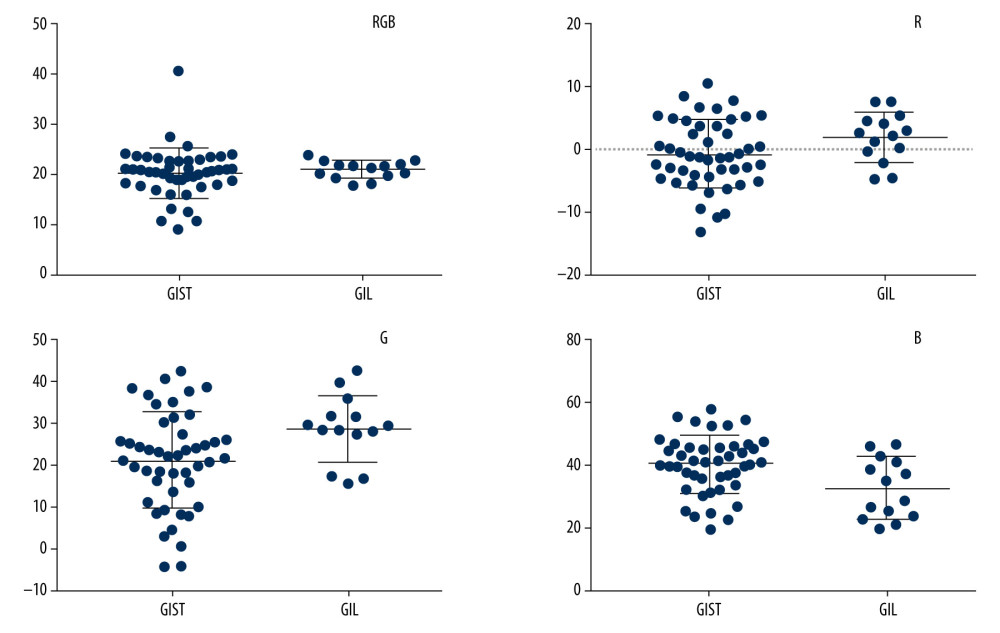 Figure 4. Mean hue histogram values from GISTs and GILs. GIST – gastrointestinal stromal tumor; GIL – gastrointestinal leiomyoma.
 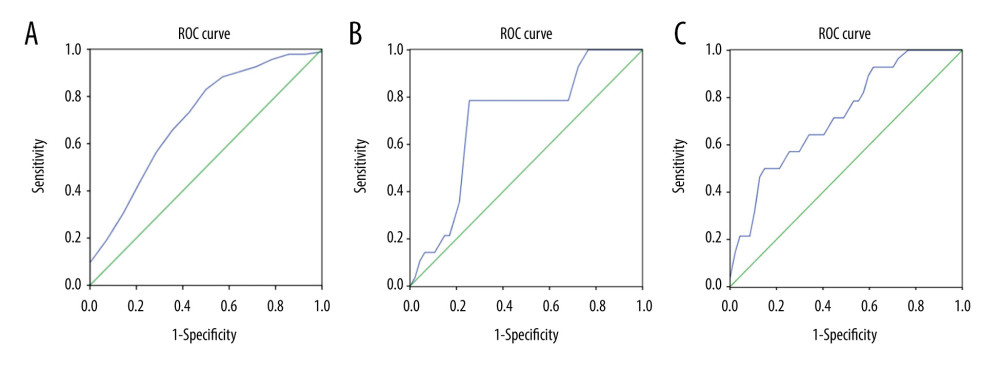 Figure 5. ROC curve of B values, G values, and combined B and G values. ROC curve analysis of B (A) and G (B) values were performed to evaluate the diagnostic utility for GISTs and GILs, respectively. The utility of differential diagnosis of GISTs and GILs was evaluated by ROC curve analysis combining B and G values (C).
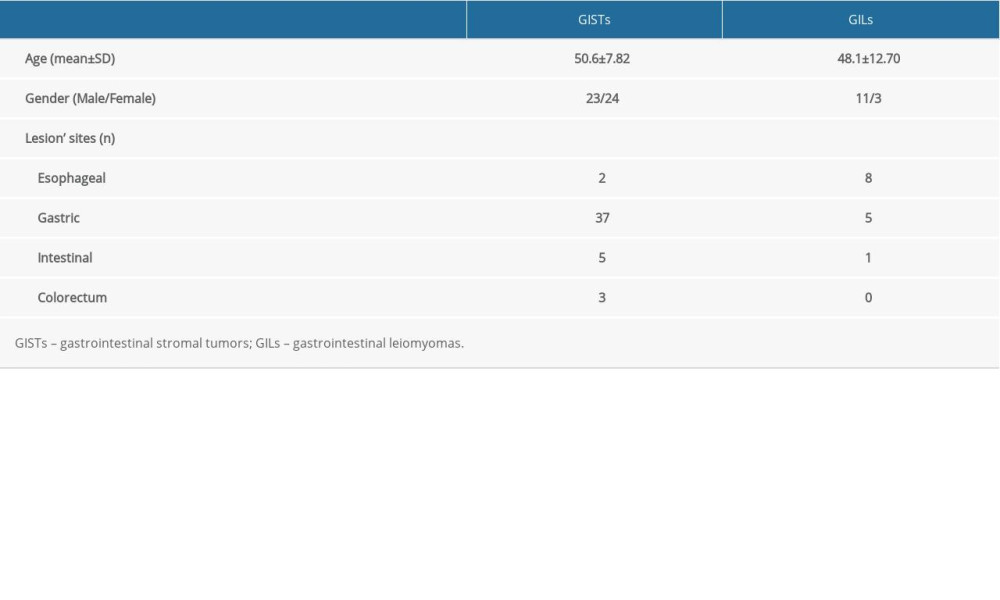
References
1. Zhang X, Modayil R, Criscitelli T, Stavropoulos SN, Endoscopic resection for subepithelial lesions – pure endoscopic full-thickness resection and submucosal tunneling endoscopic resection: Transl Gastroenterol Hepatol, 2019; 4; 39
2. Abraham SC, Krasinskas AM, Hofstetter WL, “Seedling” mesenchymal tumors (gastrointestinal stromal tumors and leiomyomas) are common incidental tumors of the esophagogastric junction: Am J Surg Pathol, 2007; 31(11); 1629-35
3. Kim GH, Kim KB, Lee SH, Digital image analysis of endoscopic ultrasonography is helpful in diagnosing gastric mesenchymal tumors: BMC Gastroenterol, 2014; 14; 7
4. Yin X, Yin Y, Liu X, Identification of gastrointestinal stromal tumors from leiomyomas in the esophagogastric junction: Medicine, 2020; 99(17); e19884
5. Tsuji Y, Kusano C, Gotoda T, A pilot study: Digest Endosc, 2016; 28(2); 173-78
6. de Moura DTH, McCarty TR, Jirapinyo P, A large multicenter study: Gastrointest Endosc, 2020; 92(1); 108-19
7. Iglesias-García J, Lariño-Noia J, Domínguez-Muñoz JE, New imaging techniques: Gastrointest Endosc Clin N Am, 2017; 27(4); 551-67
8. Dietrich CF, Săftoiu A, Jenssen C, Real time elastography endoscopic ultrasound (rte-eus), a comprehensive review: Eur J Radiol, 2014; 83(3); 405-14
9. Kwon SJ, Jeong MK, Advances in ultrasound elasticity imaging: Biomed Eng Lett, 2017; 7(2); 71-79
10. Itoh Y, Itoh A, Kawashima H, Quantitative analysis of diagnosing pancreatic fibrosis using eus-elastography (comparison with surgical specimens): J Gastroenterol, 2014; 49(7); 1183-92
11. Sigrist RMS, Liau J, Kaffas AE, Review of techniques and clinical applications: Theranostics, 2017; 7(5); 1303-29
12. Xue Y, Yao S, Li X, Zhang H, Value of shear wave elastography in discriminating malignant and benign breast lesions: Medicine, 2017; 96(42); e7412
13. Cârţână ET, Advances in endoscopic ultrasound imaging of colorectal diseases: World J Gastroenterol, 2016; 22(5); 1756
14. Kuwahara T, Hirooka Y, Kawashima H, Quantitative diagnosis of chronic pancreatitis using eus elastography: J Gastroenterol, 2017; 52(7); 868-74
15. Kuwahara T, Hara K, Mizuno N, Review of the literature: J Med Ultrason, 2020; 47(3); 413-20
16. Shi S, Liang C, Xu J, The strain ratio as obtained by endoscopic ultrasonography elastography correlates with the stroma proportion and the prognosis of local pancreatic cancer: Ann Surg, 2020; 271(3); 559-65
17. Săftoiu A, Vilmann P, Ciurea T, Dynamic analysis of eus used for the differentiation of benign and malignant lymph nodes: Gastrointest Endosc, 2007; 66(2); 291-300
18. Kawada N, Tanaka S, Elastography for the pancreas: Current status and future perspective: World J Gastroenterol, 2016; 22(14); 3712
19. Tanaka T, Kamata M, Fukaya S, Does elastography potentially eliminate the need for sentinel lymph node biopsy in squamous cell carcinoma?: J Eur Acad Dermatol Venereol, 2020; 34(4); 754-61
20. Gress F, Schmitt C, Savides T, Interobserver agreement for eus in the evaluation and diagnosis of submucosal masses: Gastrointest Endosc, 2001; 53(1); 71-76
21. Kim SH, Yoo IK, Kwon CI, A pilot study (with video): Gastrointest Endosc, 2020; 91(1); 172-77
22. Ignee A, Jenssen C, Hocke M, Contrast-enhanced (endoscopic) ultrasound and endoscopic ultrasound elastography in gastrointestinal stromal tumors: Endosc Ultrasound, 2017; 6(1); 55
23. Schrader H, Wiese M, Ellrichmann M, Relationship with pancreatic fibrosis: Ultraschall Med, 2012; 33(7); E196-201
24. Săftoiu A, Vilmann P, Gorunescu F, A multicenter study: Endoscopy, 2011; 43(7); 596
25. Săftoiu A, Vilmann P, Gorunescu F, Neural network analysis of dynamic sequences of eus elastography used for the differential diagnosis of chronic pancreatitis and pancreatic cancer: Gastrointest Endosc, 2008; 68(6); 1086-94
26. Seo SW, Hong SJ, Han JP, Accuracy of a scoring system for the differential diagnosis of common gastric subepithelial tumors based on endoscopic ultrasonography: J Digest Dis, 2013; 14(12); 647-53
27. Iglesias-Garcia J, Lindkvist B, Lariño-Noia J, Contrast-enhanced harmonic (ceh-eus), quantitative-elastography (qe-eus), or both?: United Eur Gastroent, 2017; 5(2); 236-46
28. Havre RF, Waage JR, Gilja OH, Strain ratio measurements are influenced by the position of the reference area: Ultraschall Med, 2012; 33(6); 559-68
29. Nijhawan S, Jain P, Acute pancreatitis as an unusual complication of corrosive ingestion: J Gastrointestin Liver Dis, 2007; 16(3); 345-46
30. Jacobson BC, Pressed for an answer: Has elastography finally come to eus?: Gastrointest Endosc, 2007; 66(2); 301-3
31. Taşkın O, Armutlu A, Adsay V, Clinicopathologic and immunohistochemical characteristics of upper gastrointestinal leiomyomas harboring interstitial cells of cajal: A potential mimicker of gastrointestinal stromal tumor: Ann Diagn Pathol, 2020; 45; 151476
Figures
Figure 1. Selection process and distributions of the diseases among the patients (flow chart). In the process, EUS elastography images and histopathologic results of subjects included in the study were acquired from the system and sent to the designated computer for further analysis by researcher A. Next, researcher B selected qualified images from included subjects’ EUS elastography images and numbered all qualified images with random numbers. Hue histogram analysis of numbered images and statistical analysis were carried out by researcher C and researcher D, respectively. Among the researchers, B, C, and D were blinded to patient history and the aim of the study.Figure 2. The introduction of EUS elastography image (A) and hue mean histogram (B). The image shows the EUS and EUS elastography of a patient with gastrointestinal stromal tumor in stomach. Figure A the left part is an EUS image, on which we can see 5 layers of the gastric tract wall, lined mucosa, muscularis mucosa, submucosa, muscularis propria, and serosa from inside to outside, and the focus sited in the layer of muscularis propria. Figure A the right part is an EUS elastography image, which is superimposed by colors of blue (hard tissues), green (intermedium tissues), and red (soft tissues) according to different elasticity produced by different tissues. The bottom-left corner is the appearance of electronic endoscopy. Figure B this picture shows the mean hue histogram of an area we selected (ROI). There were 4 channels: the front-most is the RGB channel, which was mixed by following 3 channels of R channel, G channel, and B channel. Each image shows the mean value and SEM; for example, 71.29 and 34.02 of RGB channel in this picture. Simultaneously, we obtained mean values of separated channels of R, G, and B respectively.Figure 3. The EUS elastography images of GIST (A) and GIL (B). The pictures were print-screened from Photoshop CC in the process of hue histogram analysis. We obtained Figure A from a patient with GIST and Figure B from a patient with GIL by use of the elastography system in our hospital. In these pictures, the left side shows EUS and EUS elastography images and the right side shows the hue histogram of the region of interest (ROI), circled by a dotted line in the left side as the picture. There are 4 channels – RGB, R, G, and B – in the hue histogram and mean hue histogram values, and their standard deviations were calculated as 70.71±30.34 (A) and 53.29±30.15 (B) in the RGB channel.Figure 4. Mean hue histogram values from GISTs and GILs. GIST – gastrointestinal stromal tumor; GIL – gastrointestinal leiomyoma.Figure 5. ROC curve of B values, G values, and combined B and G values. ROC curve analysis of B (A) and G (B) values were performed to evaluate the diagnostic utility for GISTs and GILs, respectively. The utility of differential diagnosis of GISTs and GILs was evaluated by ROC curve analysis combining B and G values (C). In Press
07 Mar 2024 : Clinical Research
Knowledge of and Attitudes Toward Clinical Trials: A Questionnaire-Based Study of 179 Male Third- and Fourt...Med Sci Monit In Press; DOI: 10.12659/MSM.943468
08 Mar 2024 : Animal Research
Modification of Experimental Model of Necrotizing Enterocolitis (NEC) in Rat Pups by Single Exposure to Hyp...Med Sci Monit In Press; DOI: 10.12659/MSM.943443
18 Apr 2024 : Clinical Research
Comparative Analysis of Open and Closed Sphincterotomy for the Treatment of Chronic Anal Fissure: Safety an...Med Sci Monit In Press; DOI: 10.12659/MSM.944127
08 Mar 2024 : Laboratory Research
Evaluation of Retentive Strength of 50 Endodontically-Treated Single-Rooted Mandibular Second Premolars Res...Med Sci Monit In Press; DOI: 10.12659/MSM.944110
Most Viewed Current Articles
17 Jan 2024 : Review article
Vaccination Guidelines for Pregnant Women: Addressing COVID-19 and the Omicron VariantDOI :10.12659/MSM.942799
Med Sci Monit 2024; 30:e942799
14 Dec 2022 : Clinical Research
Prevalence and Variability of Allergen-Specific Immunoglobulin E in Patients with Elevated Tryptase LevelsDOI :10.12659/MSM.937990
Med Sci Monit 2022; 28:e937990
16 May 2023 : Clinical Research
Electrophysiological Testing for an Auditory Processing Disorder and Reading Performance in 54 School Stude...DOI :10.12659/MSM.940387
Med Sci Monit 2023; 29:e940387
01 Jan 2022 : Editorial
Editorial: Current Status of Oral Antiviral Drug Treatments for SARS-CoV-2 Infection in Non-Hospitalized Pa...DOI :10.12659/MSM.935952
Med Sci Monit 2022; 28:e935952