18 September 2020: Database Analysis
Development and Validation of a Novel Immune-Gene Pairs Prognostic Model Associated with CTNNB1 Alteration in Hepatocellular Carcinoma
Junyu Huo1ABCDEF, Liqun Wu1AEF*, Yunjin Zang1AEDOI: 10.12659/MSM.925494
Med Sci Monit 2020; 26:e925494


Abstract
BACKGROUND: Immunotherapy is one of the research hotspots in the field of hepatocellular carcinoma (HCC). Successive clinical trials have shown that patients with CTNNB1 mutations are resistant to immunotherapy, but the mechanism is still unclear.
MATERIAL AND METHODS: We identified differentially expressed immune genes (DEIGs) in patients with and without CTNNB1 mutations in the Cancer Genome Atlas (TCGA) database and then paired them to explore any correlation with prognosis. Univariate Cox regression analysis and Lasso regression analysis were used to develop the prognostic model. We first divided the TCGA cohort into 29 subgroups for internal validation and then used the International Cancer Genome Consortium (ICGC) cohort to conduct external validation. We also used a CIBERSORT algorithm to quantify immune infiltration of the different risk groups.
RESULTS: The novel prognostic model consisted of 45 immune-gene pairs with general applicability. It was more accurate than the traditional prognostic signature, which is based on gene expression by comparison of area under the receiver operating characteristic curve (AUC) values. The infiltration proportion of B cells, CD8 T lymphocytes, activated natural killer cells, and M1 macrophages in the low-risk group was greater in the high-risk group, while the infiltration proportion of M0 and M2 macrophages was greater in the high-risk group.
CONCLUSIONS: In this study, a novel approach was proposed for evaluating HCC prognosis, which may be useful in evaluatingthe intensity of the immune response in the HCC microenvironment.
Keywords: Carcinoma, Hepatocellular, Databases, Nucleic Acid, Liver Neoplasms, Macrophages, Models, Immunological, Neoplasm Proteins, tumor microenvironment, beta Catenin
Background
Despite the great progress made in treatment of hepatocellular carcinoma (HCC), the prognosis for patients with the disease remains poor [1–3]. In recent years, immunotherapies and particularly immune checkpoint inhibitors, has revolutionized treatment of many malignancies. HCC is a typical inflammation-related cancer that occurs in the presence of immunosuppression, making immunotherapy a potentially attractive treatment option [1,4–6]. However, some recent clinical trials have found that patients with
A recent study found that activation of β-catenin promoted immune escape as well as resistance to anti-programmed cell death protein-1 therapy for HCC. The mechanism may be related to defective dendritic cells (DC) and antigen-specific T-cell recruitment [9]. In a mouse model, activation of β-catenin led to poor T-cell infiltration, promoting immune escape and leading to resistance to immunotherapy.7 Although the relationship between
In this study, we attempted to explore the immunophenotype of HCC from the perspective of mutations in
Material and Methods
DATA COLLECTION:
mRNA Sequence data from 374 HCC samples came from TCGA (
IDENTIFICATION OF DEIRGS:
The “edgeR” R package was used to identifying differentially expressed immune-related genes (DEIRGs) in 276 HCC samples free of
ANNOTATIONS OF DEIRG BIOLOGICAL PROCESSES:
The “clusterProfiler” R package was used to annotate the function of the DEIRGs and conduct enrichment analysis of their involvement in biological processes (gene ontology). The threshold value was an FDR <.05.
CONSTRUCTION AND VALIDATION OF IMMUNE GENE-PAIRS PROGNOSTIC MODEL:
We then paired the DEIRGs. In each gene pair, if the expression level of the former gene was higher than that of the latter gene, the value assigned was 1. On the contrary, if the expression level of the former gene was lower than that of the latter gene, the value assigned was 0. Immune-gene pairs with values of 0 or 1 that comprised less than 20% of the TCGA cohort were excluded. A total of 14 485 immune gene pairs were obtained after screening. Univariate Cox regression analysis was applied to identify the immune gene pairs associated with prognosis (
INDEPENDENCE VALIDATION OF THE PROGNOSTIC MODEL:
Univariate and multivariate Cox regression analysis assisted in verifying whehter risk score could independent predict HCC prognosis in the TCGA and ICGC cohorts.
ANALYSIS OF ASSOCIATION BETWEEN RISK SCORE AND CLINICOPATHOLOGY:
We used the Wilcoxon test or Kruskal’s algorithm (multiple groups) to analyzing the association between the risk score and clinicopathology (including AJCC-TNM stage, histologic grade, vascular tumor cell type, tumor status, and new tumor event after initiation of treatment). P<0.05 was deemed to be statistically significant. The “beeswarm” package in the R software was used to generate the boxplot.
ANALYSIS OF INFILTRATION OF IMMUNE CELLS IN DIFFERENT RISK GROUPS:
The CIBERSORT algorithm assesses cell composition in complex tissues based on standardized gene presentation data, quantifying the richness of specific kinds of cells [16]. We used this method (with a characteristics matrix of 547 genes standing for 22 kinds of infiltrating immune cells) to quantify immune cell infiltration in tumor tissues from groups with high and low risks, respectively. P<.05 was used as the standard by which to judge accuracy of the estimation.
STATISTICAL ANALYSIS:
Statistical analyses were conducted with R software v3.6.1 (R Foundation for Statistical Computing, Vienna, Austria) as well as with GraphPad Prism v7.00 (GraphPad Software Inc., United States). Analysis of qualitative variables was performed with Pearson’s χ2 test or Fisher’s exact test; analysis of quantitative variables was done with a non-parametric Wilcoxon test for unpaired samples in the appropriate mode. Analysis of various normalized data groups was done with Kruskal’s algorithm.
Results
IDENTIFICATION OF DIFFERENTIALLY EXPRESSED IMMUNE GENES:
Immune cell infiltration in tumor tissues in the wild-type (WT) CTNNB1 group was significantly different from that in the mutated CTNNB1 group (Figure 1A). Among the 434 differentially expressed immune genes (the heat map shown in Figure 1B), 231 were upregulated in the non-CTNNB1-mutated group (n=276), and their biological processes mainly involved activation and regulation of leukocytes and lymphocytes (Figure 1C). We found that 203 genes were upregulated in the CTNNB1-mutated group (n=98), and their biological processes were mainly related to innate immune response and to regulation of the Fc receptor signaling pathway. (Figure 1D). This may help to explain the insensitivity of CTNNB1-mutated HCC to immunotherapy.
CONSTRUCTION OF A ROBUST PROGNOSTIC MODEL CONSISTING OF 45 IMMUNE GENE PAIRS:
Univariate Cox regression analysis showed that among the 14 485 gene pairs, 480 i were associated with prognosis (P<.001). After the overfitting was removed using Lasso regression, a robust prognostic model consisting of 45 immune gene pairs was established (Table 1). According to the ROC curve, the optimal critical value for dividing the group in to highand low risk was.886. Kaplan-Meier survival curve analysis showed that the group with high risk had lower rates of overall (OS) and disease-specific survival (DFS) relative to the group with low risk (Figure 2A, 2C). AUC values for 1-, 2-, 3-, 4-, and 5-year OS reached.899,.905,.892,.915, and.894, respectively (Figure 2B) and those for DFS were.956,.945,.936,.935, and.903, respectively (Figure 2D). As displayed in the survival status map, a risk score increase meant an obvious increase in the number of patient deaths (Figure 3A). As illustrated in univariate and multivariate Cox regression analyses, only risk score was an independent predictor of prognosis (Figure 3B, 3C).
INTERNAL VALIDATION BASED ON CLINICAL FEATURES OF TCGA:
To observe whether the model constructed was applicable to different populations, we divided the patients into 29 subgroups according to their clinical characteristics (including sex, age, race, BMI, alpha-fetoprotein levels, histological grade, vascular invasion, AJCC-TNM stage, family history of cancer, malignancy history, new tumors presenting following initial treatment, and individual tumor status) for internal verification. The survival curve showed that in each subgroup, the group with a high risk had lower OS relative to the group with low risk (Figure 4A–4L). This indicated that our prognostic model had universal applicability.
CORRELATION ANALYSIS BETWEEN RISK SCORE AND CLINICOPATHOLOGY:
With increasing histological grade, AJCC stage, and vascular invasion, patients’ median risk scores gradually increased. Median risks score in patients with new tumors after initial treatment were higher than in those without new tumors, and median risk scores in patients with a tumor was higher than those in individuals without tumors (Figure 5). We also carried out Chi-squared tests on the two groups, which revealed an obvious difference in clinical stage, histological grade, vascular invasion degree, and tumor histological grade between them, which may help to explain the differences in their prognoses (Tables 2, 3).
EXTERNAL VALIDATION REGARDING THE PROGNOSTIC MODEL IN THE ICGC COHORT:
Patient risk scores in the ICGC cohort were calculated based on the risk score calculation formula from the TCGA cohort. The cutoff values of the groups with high and low risks were the same as those for the TCGA cohort. As with the TCGA cohort, the group with a high risk had a poor prognosis (Figure 6A). AUC values for 1-, 2-, 3-, 4-, and 5-year OS reached.831,.727,.730,.786 and.786, respectively (Figure 6B). As revealed by univariate and multivariate Cox regression analyses, risk score was an independent predictor of prognosis (Figure 6C, 6D).
INFILTRATION OF IMMUNE CELLS IN TUMOR TISSUE BETWEEN DIFFERENT RISK GROUPS:
After screening (P<.05), 42 tumor tissues from the low-risk group and 38 tumor tissues from the high-risk group were included. The infiltration ratio for B cells, CD8 T lymphocytes, activated natural killer cells, and M1 macrophages in the group with low risk appeared higher relative to the group with high risk, while the latter group had a higher infiltration ratio for M0 and M2 macrophages relative to the former group (Figure 7).
Discussion
The prognosis for patients with HCC is still not satisfactory, mainly because most cases are only diagnosed when the disease is advanced [1]. Adjuvant therapy, such as immunotherapy, is one of the primary treatments for advanced HCC. However, several recent clinical trials have found that patients who have HCC with
In this study, we found that several immune cells in tumor tissues with
After it was clear that the differentially expressed genes could significantly affect the immune response of the tumor, we combined them in pairs. This is a different approach than that in previous studies. Most previous studies have assessed the association between a single gene and prognosis based on its level of expression. With gene pairing, we were able to analyze the effect of the relative expression level of two genes on prognosis, transforming continuous variables into a dichotomous variable. With this methods, other centers using the model would not have to carry out batch normalization.
We screened 45 gene pairs from 480 immune gene pairs related to prognosis by means of lasso regression. The results showed that risk stratification of patients with based on these 45 immune gene pairs was very accurate, especially for evaluating the specific survival rate for HCC. It was important that the prognostic model had universal applicability and could be applied to people with different clinical characteristics. In addition, risk scores were associated with factors correlated with poor prognosis, such as low tumor differentiation, vascular invasion, and advanced clinical stage. This may help to explain the difference in prognosis between different groups.
Finally, we used the ICGC dataset to conduct external verification of the prognostic model. Conforming to the findings of the TCGA cohort, the prognostic model was highly accurate for predicting survival in the short and long term, and it was an independent predictor of prognosis. We compared AUC values to determine the accuracy of the prognostic model relative to other prognostic signatures. AUC values for Long’s double immune gene prognostic signature were.738,.727, and.655 at 1, 3, and 5 years, respectively [17]. AUC values for Wang’s 9-immune-gene prognostic signature were.811,.711, and.734 at 1, 3, and 5 years, respectively [18]. AUC values for Li’s 6-immune-gene prognostic signature were.761,.681, and.692 at 1, 3, and 5 years, respectively [19]. AUC values for our prognostic model at 1, 3, and 5 years were.899,.892, and.894, respectively. Obviously, our prognostic model has more value than any of the traditional prognostic immune signatures.
Tumor microenvironment (TME) is the cellular environment of tumor cells, and includes tumor stromal cells, the extracellular matrix, and soluble molecules. Once the TME is shaped, a lot of immune cells, such as T cells, macrophages, and myelogenic inhibitory cells, are drawn by chemotaxis to constitute it [20]. In the TME, immune and stromal cells, which are major types of non-tumor components, may have a role in diagnosis and prognostication of tumors [21,22]. As found in this study, prognosis for patients in the group with low risk was dramatically better than in the group with high risk. Garnelo [23] found that patients with higher proportions of tumor-infiltrating T and B cells had stronger local immune activity and better prognosis. This was consistent with our research results. In addition, patients whose activated NK-cell infiltration level was high had better prognosis. That is in accord with conclusions by Zhu and other researchers [24].
Tumor-associated macrophages (TAMs) are macrophages that infiltrate tumor tissues and they make up the largest number of immune cells in the TME [25,26]. M1 macrophages have an antitumor effect, which can distinguish tumor cells from normal cells and eventually kill tumor cells by identifying them. M2 macrophages mainly promote tumor development, invasion, and metastasis [27,28]. In patients who had a high level of infiltration of M2 macrophages, the prognosis was poor, while for those with high levels of M1 macrophage infiltration, the prognosis was better. Therefore, regulating the phenotype of TAM may function as a positive factor in improving prognosis in patients with HCC.
Some genes in our model have been proven to be related to tumor prognosis and immune regulation. For example,
Conclusions
Our study provides a new way to evaluate prognosis in patients with HCC, but there are still some limitations. Although our prognostic model has been verified internally and externally, this was a retrospective study, so further prospective clinical trials are necessary. The relative expression level exhibited by the two immune genes had a significant impact on prognosis and further study of its mechanism is warranted.
This research suggests a novel approach for evaluating the prognosis of HCC, which may be beneficial for guiding individualized treatment of patients.
Figures
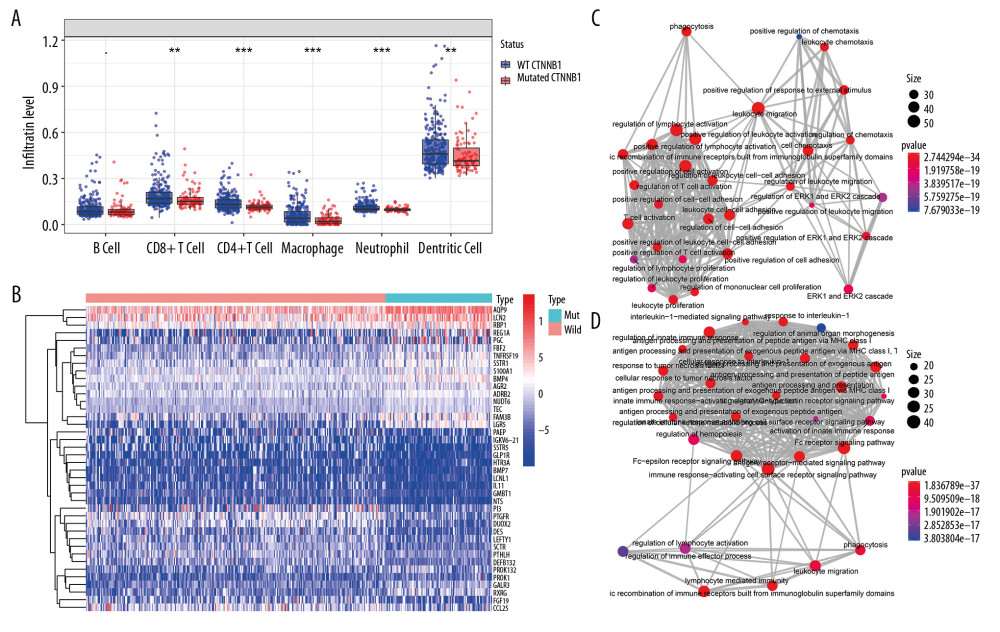 Figure 1. Identification of differential expressed immune-related genes (DEIRGs) between with and without CTNNB1 mutation HCC in TCGA. (A) Boxplot of immune cell infiltration in with and without CTNNB1 mutation HCC patients (P-value significant codes: 0< *** <0.001< ** <0.01< * <0.05). (B) Heatmap of DEIRGs in the significantly enriched gene sets in CTNNB1-mutant HCC. (C) The biological process Enrichment Map of DEIRGs upregulated in the WT-CTNNB1. (D) The biological process Enrichment Map of DEIRGs upregulated in the mutated-CTNNB1.
 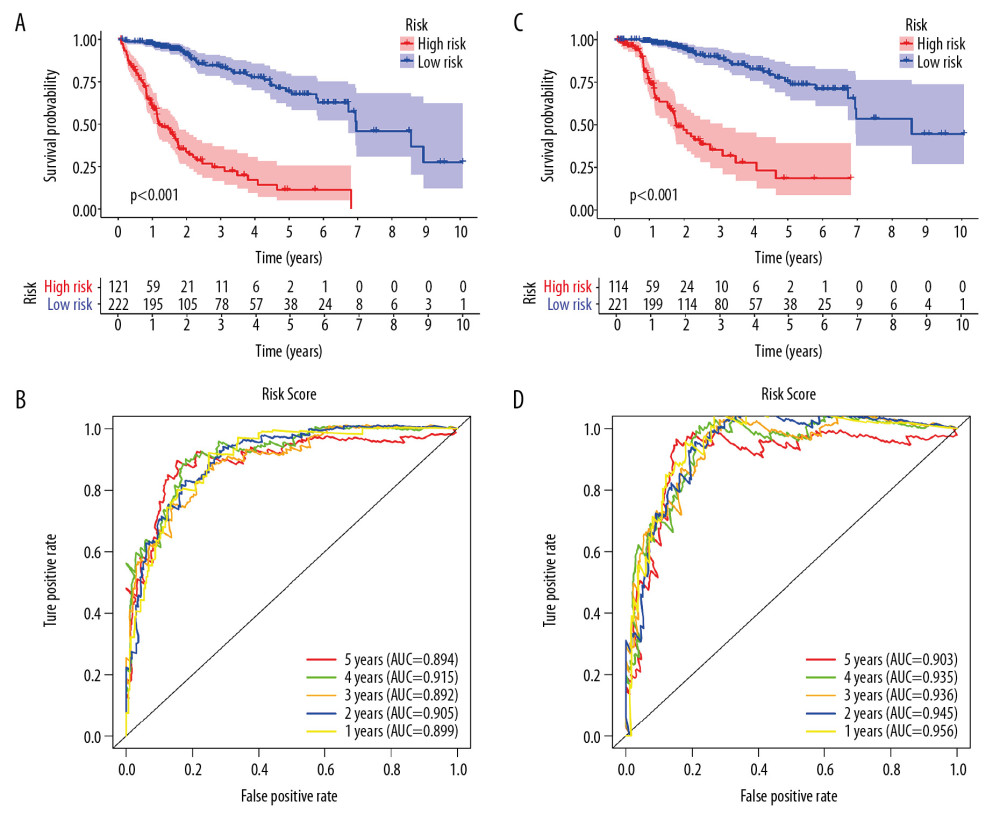 Figure 2. Survival analysis of the prognostic model. (A, B) The Kaplan-Meier survival curve of overall survival (OS) and disease-specifici survival (DSS) in TCGA cohort (C, D) The time-dependent ROC curve of overall survival (OS) and diseasespeciFIC survival (DSS) in the TCGA cohort
 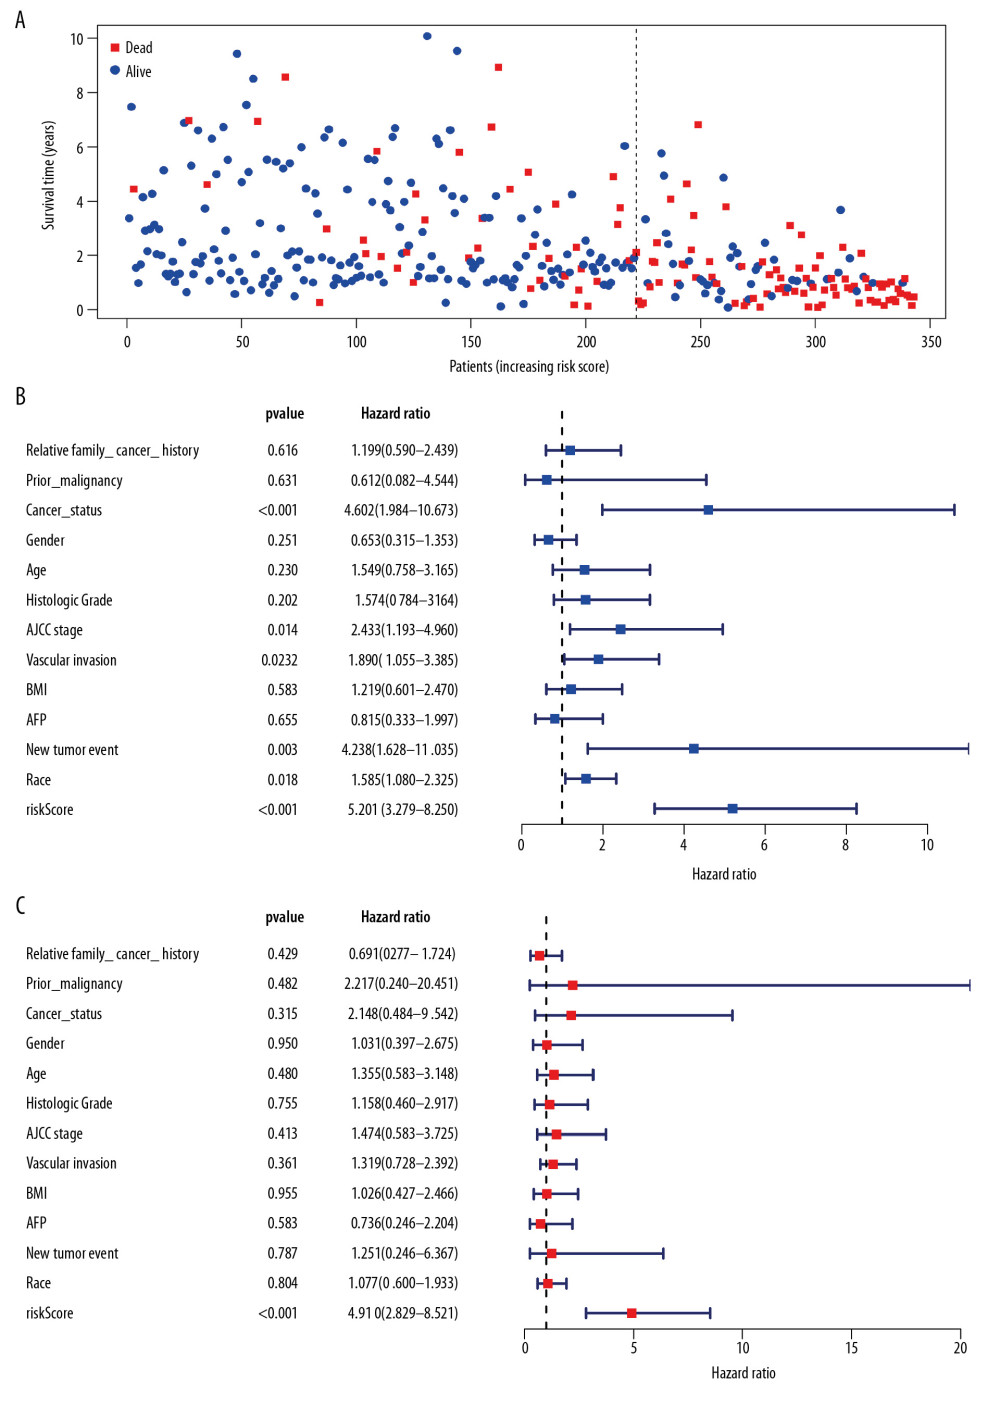 Figure 3. Independent validation of the prognostic model. (A) Survival status of patients in the TCGA cohort. (B) Univariate cox regression analyses of the association between clinicopathological factors and OS. (C) Multivariate Cox regression analyses of the association between clinicopathological factors and OS.
 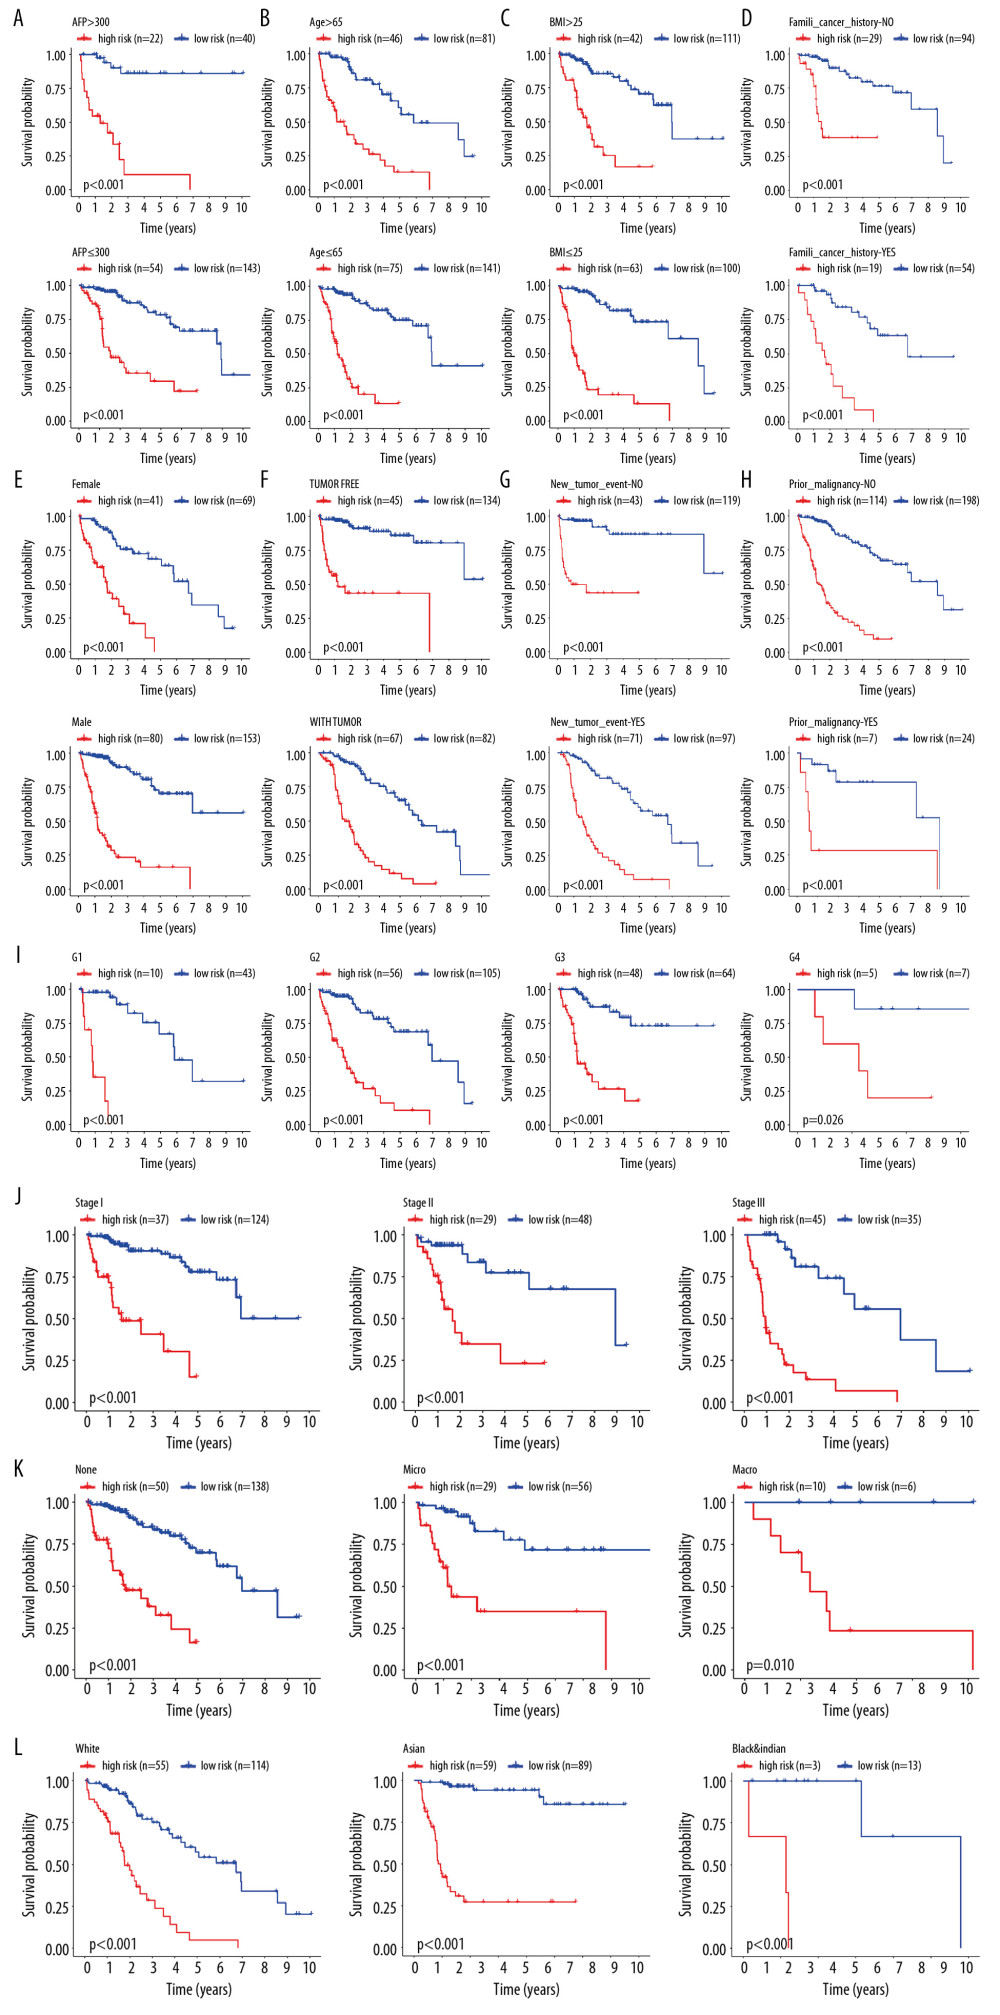 Figure 4. Internal validation of the prognostic model in the TCGA cohort according to clinical features. (A) AFP. (B) Age. (C) BMI. (D) Family cancer history. (E) Gender. (F) Tumor status. (G) New tumor event after treatment initiation. (H) Prior malignancy. (I) Histologic grade. (J) AJCC stage. (K) Vascular tumor cell type. (L) Race.
 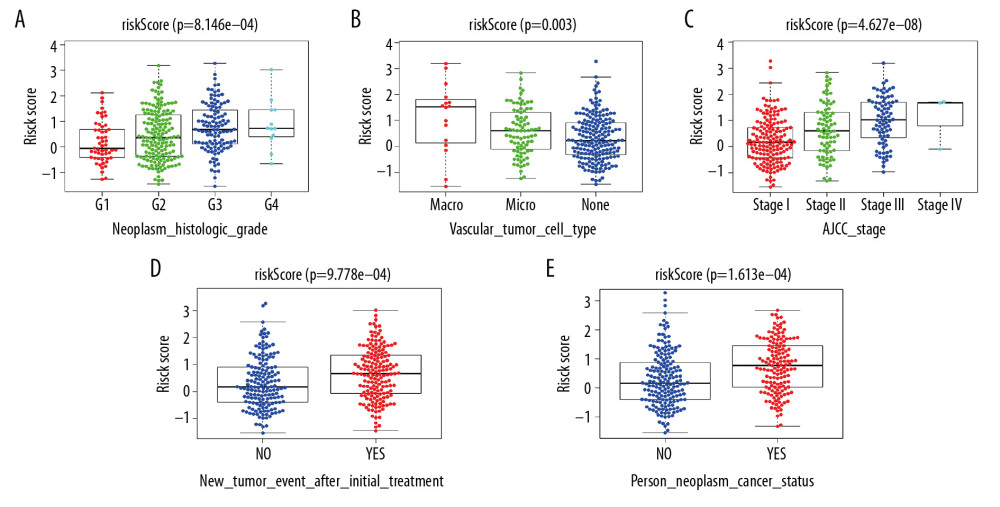 Figure 5. Correlation of risk score with clinicopathological characteristics. (A) Histopathological grade. (B) Vascular tumor cell type. (C) AJCC stage. (D) New tumor event after treatment initiation. (E) Cancer status.
 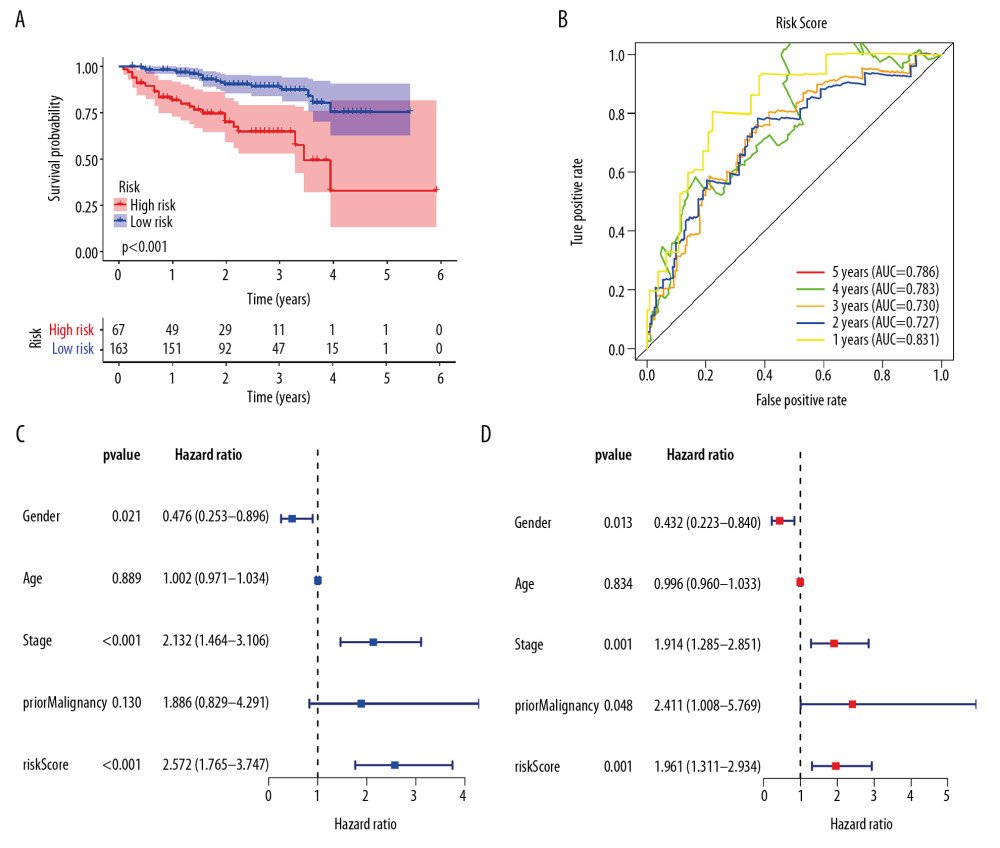 Figure 6. External validation of the prognostic model in the ICGC cohort. (A) Kaplan-Meier curve of overall survival (OS) in the ICGC cohort. (B) Time-dependent ROC analysis in the ICGC cohort. (C) Univariate cox regression analyses of the association between clinicopathological factors and OS in the ICGC cohort. (D) Multivariate Cox regression analyses of the association between clinicopathological factors and OS in the ICGC cohort.
 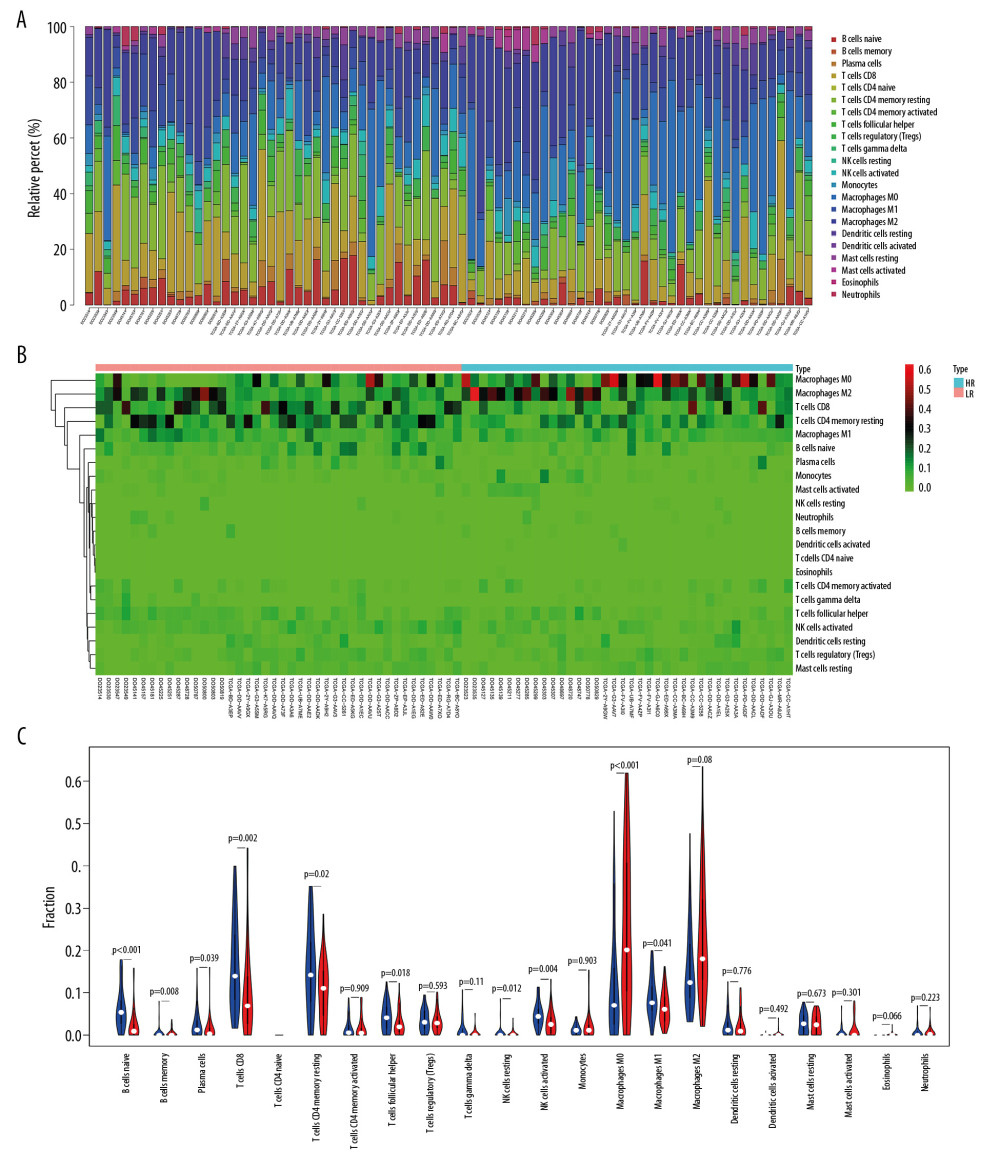 Figure 7. The immune infiltration landscape in HCC patients with high- and low-risk. (A) The barplot of the proportion of immune cell infiltration. (B) Heatmap of the proportion of immune cell infiltration. (C) Violin plot of 22 types of immune cell infiltration abundances in groups with high and low risks (red and blue denote high and low risks).
 References
1. Rebouissou S, Nault JC, Advances in molecular classification and precision oncology in hepatocellular carcinoma: J Hepatol, 2020; 72(2); 215-29
2. Park JW, Chen M, Colombo M, Global patterns of hepatocellular carcinoma management from diagnosis to death: The BRIDGE Study: Liver Int, 2015; 35(9); 2155-66
3. Yang JD, Hainaut P, Gores GJ, A global view of hepatocellular carcinoma: Trends, risk, prevention and management: Nat Rev Gastroenterol Hepatol, 2019; 16(10); 589-604
4. Flynn MJ, Sayed AA, Sharma R, Challenges and opportunities in the clinical development of immune checkpoint inhibitors for hepatocellular carcinoma: Hepatology, 2019; 69(5); 2258-70
5. Brown ZJ, Greten TF, Heinrich B, Adjuvant treatment of hepatocellular carcinoma: Prospect of immunotherapy: Hepatology, 2019; 70(4); 1437-1442
6. Hanahan D, Weinberg RA, Hallmarks of cancer: The next generation: Cell, 2011; 144(5); 646-7
7. Berraondo P, Ochoa MC, Olivera I, Melero I, Immune desertic landscapes in hepatocellular carcinoma shaped by beta-catenin activation: Cancer Discov, 2019; 9(8); 1003-5
8. Pinyol R, Sia D, Llovet JM, Immune exclusion-Wnt/CTNNB1 class predicts resistance to immunotherapies in HCC: Clin Cancer Res, 2019; 25(7); 2021-23
9. de Galarreta MR, Bresnahan E, Molina-Sánchez P, β-catenin activation promotes immune escape and resistance to anti-PD-1 therapy in hepatocellular carcinoma: Cancer Discov, 2019; 9(8); 1124-41
10. Zucman-Rossi J, Villanueva A, Nault JC, Llovet JM, Genetic landscape and biomarkers of hepatocellular carcinoma: Gastroenterology, 2015; 149(5); 1226-39.e1224
11. Liang Y, Feng Y, Zong M, β-catenin deficiency in hepatocytes aggravates hepatocarcinogenesis driven by oncogenic β-catenin and MET: Hepatology, 2018; 67(5); 1807-22
12. Khemlina G, Ikeda S, Kurzrock R, The biology of hepatocellular carcinoma: Implications for genomic and immune therapies: Mol Cancer, 2017; 16(1); 149
13. Rebouissou S, Franconi A, Calderaro J, Genotype-phenotype correlation of CTNNB1 mutations reveals different ss-catenin activity associated with liver tumor progression: Hepatology, 2016; 64(6); 2047-61
14. Itoh S, Yoshizumi T, Yugawa K, Impact of immune response on outcomes in hepatocellular carcinoma: Association with vascular formation: Hepatology, 2020 [Online ahead of print]
15. Kurebayashi Y, Ojima H, Tsujikawa H, Landscape of immune microenvironment in hepatocellular carcinoma and its additional impact on histological and molecular classification: Hepatology, 2018; 68(3); 1025-41
16. Newman AM, Liu CL, Green MR, Robust enumeration of cell subsets from tissue expression profiles: Nat Methods, 2015; 12(5); 453-57
17. Long J, Wang A, Bai Y, Development and validation of a TP53-associated immune prognostic model for hepatocellular carcinoma: EBioMedicine, 2019; 42; 363-74
18. Wang Z, Zhu J, Liu Y, Development and validation of a novel immune-related prognostic model in hepatocellular carcinoma: J Transl Med, 2020; 18(1); 67
19. Li W, Lu J, Ma Z, An integrated model based on a six-gene signature predicts overall survival in patients with hepatocellular carcinoma: Front Genet, 2019; 10; 1323
20. Whiteside TJO, The tumor microenvironment and its role in promoting tumor growth: Oncogene, 2008; 27(45); 5904-12
21. Gajewski TF, Schreiber H, Fu Y-X, Innate and adaptive immune cells in the tumor microenvironment: Nat Immunol, 2013; 14(10); 1014
22. Joyce JA, Therapeutic targeting of the tumor microenvironment: Cancer Cell, 2005; 7(6); 513-20
23. Garnelo M, Tan A, Her Z, Interaction between tumour-infiltrating B cells and T cells controls the progression of hepatocellular carcinoma: Gut, 2017; 66(2); 342-51
24. Zhu L, Zhou J, Liu Y, Pan WDPrognostic significance of natural killer cell infiltration in hepatocellular carcinoma: Ai Zheng, 2009; 28(11); 1198-202 [in Chinese]
25. Zhang Y, Yu G, Chu H, Macrophage-associated PGK1 phosphorylation promotes aerobic glycolysis and tumorigenesis: Mol Cell, 2018; 71(2); 201-15.e207
26. Mitchem JB, Brennan DJ, Knolhoff BL, Targeting tumor-infiltrating macrophages decreases tumor-initiating cells, relieves immunosuppression, and improves chemotherapeutic responses: Cancer Res, 2013; 73(3); 1128-41
27. Mantovani A, Marchesi F, Malesci A, Tumour-associated macrophages as treatment targets in oncology: Nature Rev Clin Oncol, 2017; 14(7); 399-416
28. Heusinkveld M, van der Burg SH, Identification and manipulation of tumor associated macrophages in human cancers: J Transl Med, 2011; 9(1); 216
29. Sohn M, Shin S, Yoo J-Y, Ahnak promotes tumor metastasis through transforming growth factor-β-mediated epithelial-mesenchymal transition: Sci Rep, 2018; 8(1); 1-10
30. Sharma S, Kadam P, Dubinett S, CCL21 programs immune activity in tumor microenvironment: Tumor microenvironment, 2020; 67-78, Springer
31. Boles NC, Lin KK, Lukov GL, CD48 on hematopoietic progenitors regulates stem cells and suppresses tumor formation: Blood, 2011; 118(1); 80-87
32. Forero A, Ozarkar S, Li H, Differential activation of the transcription factor IRF1 underlies the distinct immune responses elicited by type I and type III interferons: Immunity, 2019; 51(3); 451-64.e456
33. Chen B, Lai J, Dai D: Aging (Albany, NY), 2019; 11(23); 11124
34. Ng KT-P, Qi X, Kong K-L, Overexpression of matrix metalloproteinase-12 (MMP-12) correlates with poor prognosis of hepatocellular carcinoma: Eur J Cancer, 2011; 47(15); 2299-305
35. Guo M, Härtlova A, Gierliński M, Triggering MSR1 promotes JNK-mediated inflammation in IL-4-activated macrophages: EMBO J, 2019; 38(11); e100299
36. Huang ZJ, Zhu JJ, Yang XY, Biskup E, NEDD4 promotes cell growth and migration via PTEN/PI3K/AKT signaling in hepatocellular carcinoma: Oncol Lett, 2017; 14(3); 2649-56
37. Ye K, Ouyang X, Wang Z, SEMA3F promotes liver hepatocellular carcinoma metastasis by activating focal adhesion pathway: DNA Cell Biol, 2020; 39(3); 474-83
Figures
Figure 1. Identification of differential expressed immune-related genes (DEIRGs) between with and without CTNNB1 mutation HCC in TCGA. (A) Boxplot of immune cell infiltration in with and without CTNNB1 mutation HCC patients (P-value significant codes: 0< *** <0.001< ** <0.01< * <0.05). (B) Heatmap of DEIRGs in the significantly enriched gene sets in CTNNB1-mutant HCC. (C) The biological process Enrichment Map of DEIRGs upregulated in the WT-CTNNB1. (D) The biological process Enrichment Map of DEIRGs upregulated in the mutated-CTNNB1.Figure 2. Survival analysis of the prognostic model. (A, B) The Kaplan-Meier survival curve of overall survival (OS) and disease-specifici survival (DSS) in TCGA cohort (C, D) The time-dependent ROC curve of overall survival (OS) and diseasespeciFIC survival (DSS) in the TCGA cohortFigure 3. Independent validation of the prognostic model. (A) Survival status of patients in the TCGA cohort. (B) Univariate cox regression analyses of the association between clinicopathological factors and OS. (C) Multivariate Cox regression analyses of the association between clinicopathological factors and OS.Figure 4. Internal validation of the prognostic model in the TCGA cohort according to clinical features. (A) AFP. (B) Age. (C) BMI. (D) Family cancer history. (E) Gender. (F) Tumor status. (G) New tumor event after treatment initiation. (H) Prior malignancy. (I) Histologic grade. (J) AJCC stage. (K) Vascular tumor cell type. (L) Race.Figure 5. Correlation of risk score with clinicopathological characteristics. (A) Histopathological grade. (B) Vascular tumor cell type. (C) AJCC stage. (D) New tumor event after treatment initiation. (E) Cancer status.Figure 6. External validation of the prognostic model in the ICGC cohort. (A) Kaplan-Meier curve of overall survival (OS) in the ICGC cohort. (B) Time-dependent ROC analysis in the ICGC cohort. (C) Univariate cox regression analyses of the association between clinicopathological factors and OS in the ICGC cohort. (D) Multivariate Cox regression analyses of the association between clinicopathological factors and OS in the ICGC cohort.Figure 7. The immune infiltration landscape in HCC patients with high- and low-risk. (A) The barplot of the proportion of immune cell infiltration. (B) Heatmap of the proportion of immune cell infiltration. (C) Violin plot of 22 types of immune cell infiltration abundances in groups with high and low risks (red and blue denote high and low risks). Tables
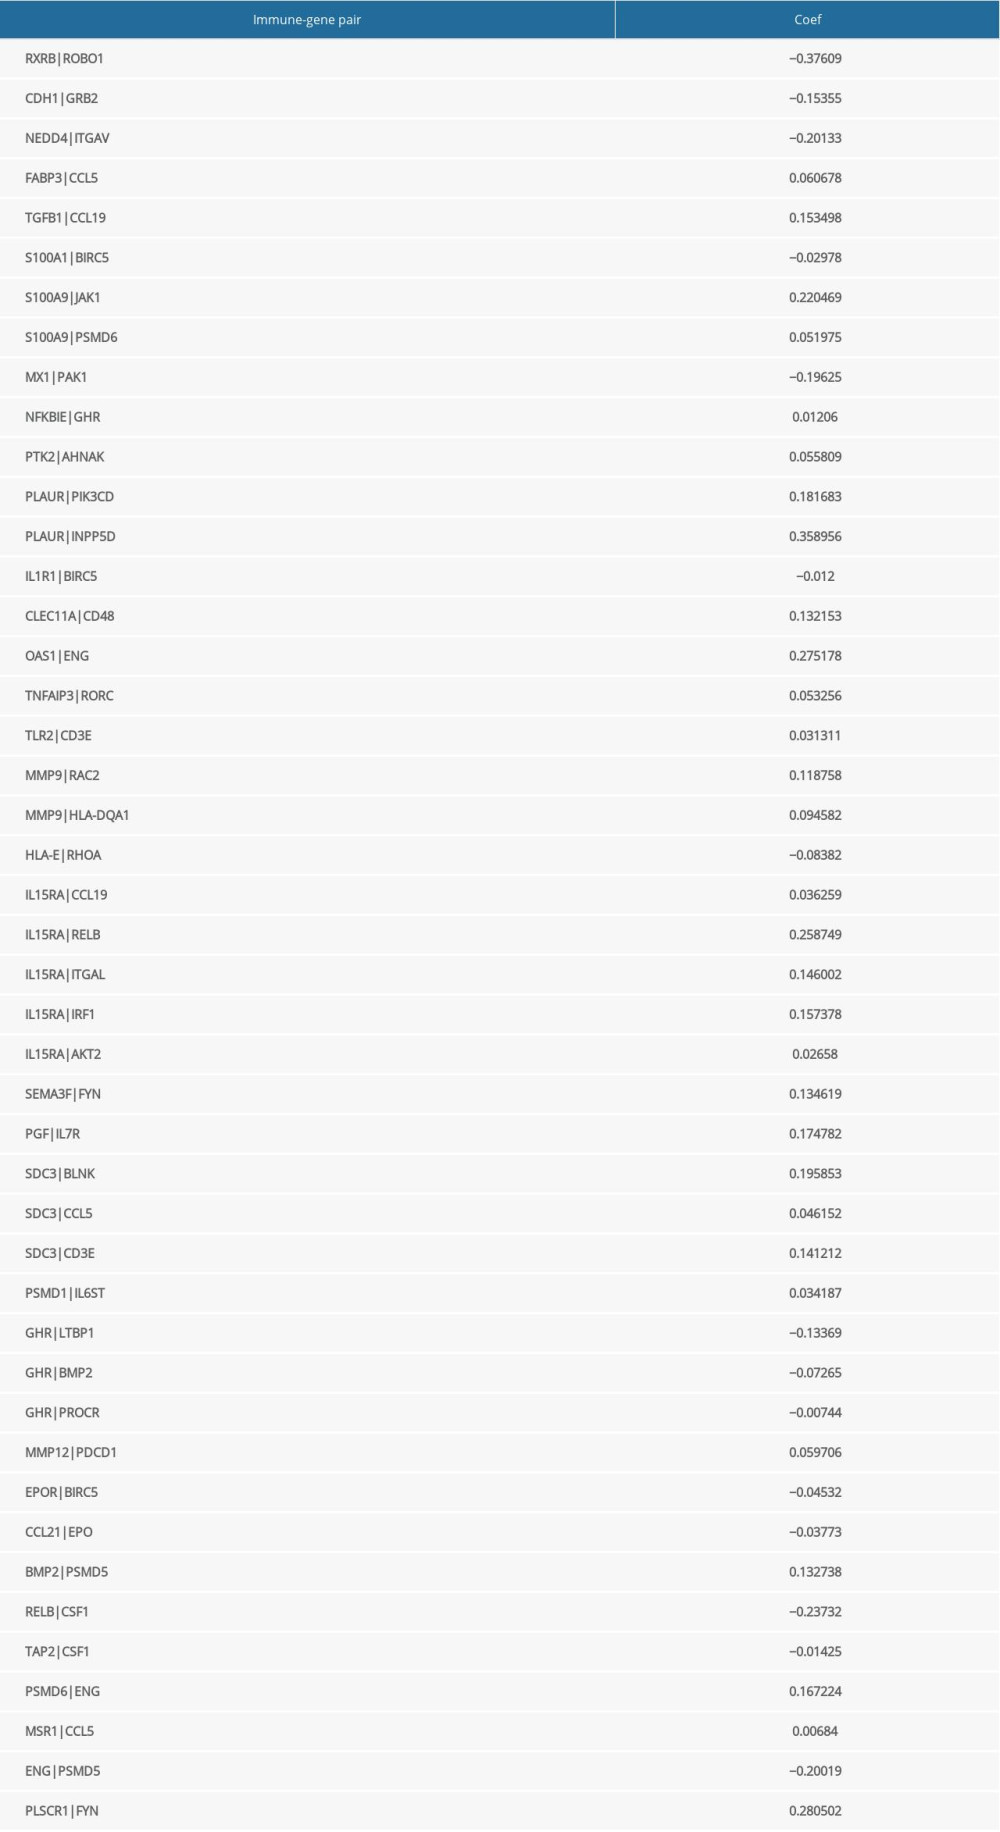 Table 1. The immune-gene pair list and coefficient.
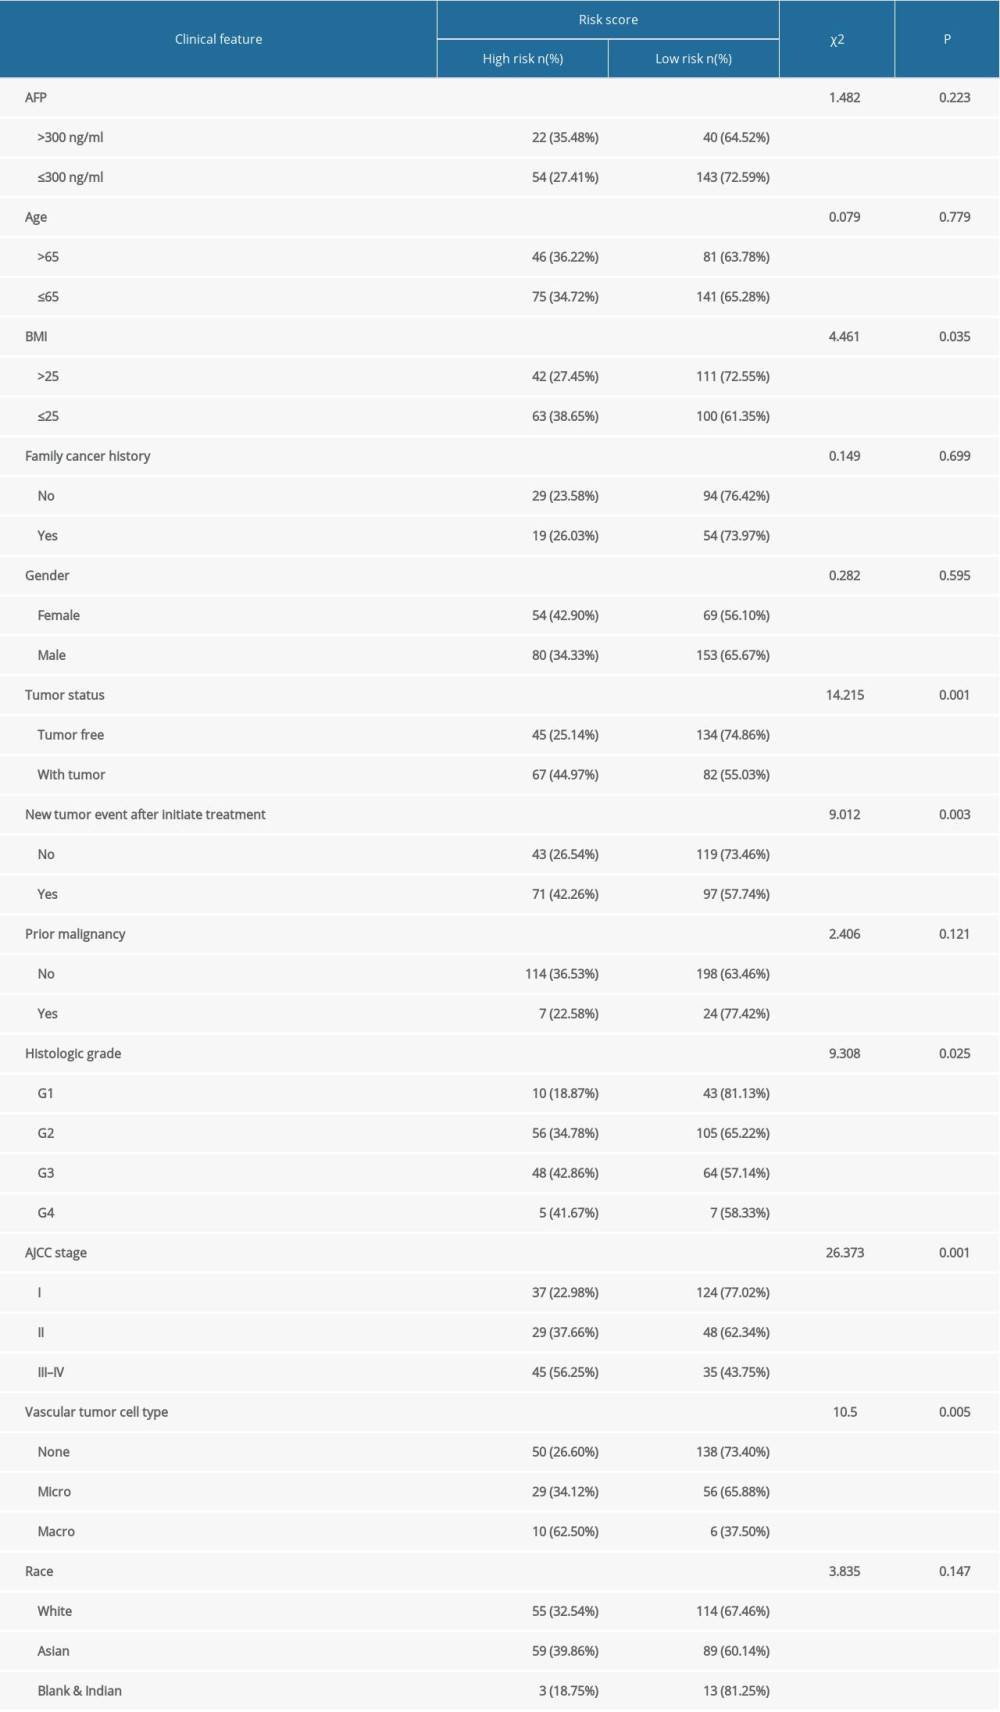 Table 2. The chi-square test of the relation between risk score and clinical features in TCGA.
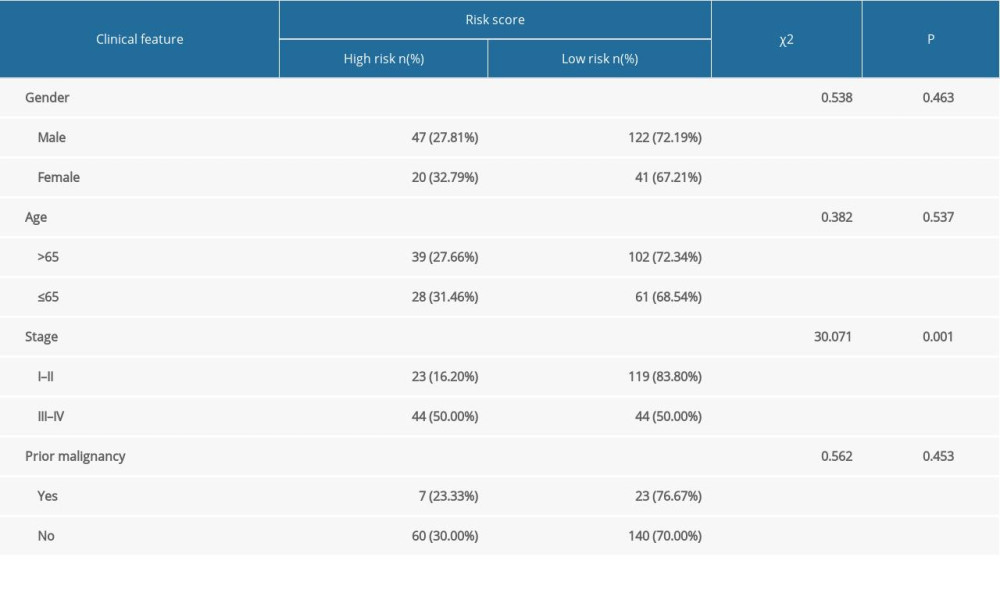 Table 3. The chi-square test of the relation between risk score and clinical features in ICGC.Table 1. The immune-gene pair list and coefficient.Table 2. The chi-square test of the relation between risk score and clinical features in TCGA.Table 3. The chi-square test of the relation between risk score and clinical features in ICGC.
 In Press
05 Mar 2024 : Clinical Research
Role of Critical Shoulder Angle in Degenerative Type Rotator Cuff Tears: A Turkish Cohort StudyMed Sci Monit In Press; DOI: 10.12659/MSM.943703
06 Mar 2024 : Clinical Research
Comparison of Outcomes between Single-Level and Double-Level Corpectomy in Thoracolumbar Reconstruction: A ...Med Sci Monit In Press; DOI: 10.12659/MSM.943797
21 Mar 2024 : Meta-Analysis
Economic Evaluation of COVID-19 Screening Tests and Surveillance Strategies in Low-Income, Middle-Income, a...Med Sci Monit In Press; DOI: 10.12659/MSM.943863
10 Apr 2024 : Clinical Research
Predicting Acute Cardiovascular Complications in COVID-19: Insights from a Specialized Cardiac Referral Dep...Med Sci Monit In Press; DOI: 10.12659/MSM.942612
Most Viewed Current Articles
17 Jan 2024 : Review article
Vaccination Guidelines for Pregnant Women: Addressing COVID-19 and the Omicron VariantDOI :10.12659/MSM.942799
Med Sci Monit 2024; 30:e942799
14 Dec 2022 : Clinical Research
Prevalence and Variability of Allergen-Specific Immunoglobulin E in Patients with Elevated Tryptase LevelsDOI :10.12659/MSM.937990
Med Sci Monit 2022; 28:e937990
16 May 2023 : Clinical Research
Electrophysiological Testing for an Auditory Processing Disorder and Reading Performance in 54 School Stude...DOI :10.12659/MSM.940387
Med Sci Monit 2023; 29:e940387
01 Jan 2022 : Editorial
Editorial: Current Status of Oral Antiviral Drug Treatments for SARS-CoV-2 Infection in Non-Hospitalized Pa...DOI :10.12659/MSM.935952
Med Sci Monit 2022; 28:e935952