29 August 2021: Clinical Research
Three-Dimensional Finite Element Analysis and Biomechanical Analysis of Midfoot von Mises Stress Levels in Flatfoot, Clubfoot, and Lisfranc Joint Injury
Chaoqiang Wang1ABCDEFG, Xiaoyu He1ABCDEF*, Zhongning Zhang1BCD, Caosheng Lai1BCD, Xueli Li2BCD, Zhiping Zhou1BC, Kangming Ruan1BCDOI: 10.12659/MSM.931969
Med Sci Monit 2021; 27:e931969


Abstract
BACKGROUND: Midfoot deformity and injury can affect the internal pressure distribution of the foot. This study aimed to use 3D finite element and biomechanical analyses of midfoot von Mises stress levels in flatfoot, clubfoot, and Lisfranc joint injury.
MATERIAL AND METHODS: Normal feet, flatfeet, clubfeet (30 individuals each), and Lisfranc injuries (50 individuals) were reconstructed by CT, and 3D finite element models were established by ABAQUS. Spring element was used to simulate the plantar fascia and ligaments and set hyperelastic coefficients in encapsulated bone and ligaments. The stance phase was simulated by applying 350 N on the top of the talus. The von Mises stress of the feet and ankle was visualized and analyzed.
RESULTS: The von Mises stress on healthy feet was higher in the lateral metatarsal and ankle bones than in the medial metatarsal bone. Among the flatfoot group, the stress on the metatarsals, talus, and navicular bones was significantly increased compared with that on healthy feet. Among patients with clubfeet, stress was mainly concentrated on the talus, and stress on the lateral metatarsal and navicular bones was significantly lower. The von Mises stress on the fractured bone was decreased, and the stress on the bone adjacent to the fractured bone was higher in Lisfranc injury. During bone dislocation alone or fracture accompanied by dislocation, the von Mises stress of the dislocated bone tended to be constant or increased.
CONCLUSIONS: Prediction of von Mises stress distribution may be used clinically to evaluate the effects of deformity and injury on changes in structure and internal pressure distribution on the midfoot.
Keywords: Ankle, Clubfoot, Finite Element Analysis, Flatfoot, Stress, Physiological, Biomechanical Phenomena, Female, Follow-Up Studies, Foot Injuries, Foot Joints, Humans, Joint Diseases, Stress, Mechanical
Background
Foot anatomy and biomechanics play crucial roles in gait and activities [1,2]. The structure of the human foot is divided into the forefoot, midfoot, and hindfoot [3]. The midfoot is essential for weight bearing and movement [4,5], and midfoot fracture is the most common type of foot fracture [6,7]. The midfoot is formed by the 5 metatarsals [8]. The first to third metatarsals, cuneiform, navicular, calcaneus, and talus comprise the medial longitudinal arch, which serves as a buffer for shocks [9]. The fourth and fifth metatarsals, cuboid, and calcaneus form the lateral longitudinal arch, which supports an upright posture [10]. Foot deformation changes stress distribution, which causes pain and dysfunction, such as flatfoot and clubfoot [11,12]. Research on the stress distribution of the internal structure contributes to the analysis of foot biomechanics and treatment strategies.
3D finite element analysis can visualize foot structure and high-precision contact stress [13,14]. It simulates foot bones and soft tissues by analyzing tissue geometry, properties, boundaries, and load conditions, revealing their anatomical and biomechanical characteristics [15,16]. The finite element modeling for measuring foot biomechanical parameters can be used to predict foot injury [17,18] and provides successful personalized therapy of clubfoot [16]. Understanding the pressure difference between different foot types is beneficial in providing individualized treatment. However, there is a lack of systematic studies on 3D finite element modeling and biomechanical analysis of midfoot deformities and injuries. This study aimed to use 3D finite element and biomechanical analyses of midfoot von Mises stress levels in flatfoot, clubfoot, and Lisfranc joint injury.
Material and Methods
ETHICS STATEMENT:
A total of 140 volunteers were recruited from September 17, 2019 to May 19, 2020. Information on the demographic and clinical characteristics all participants was collected, and foot CT scans were performed. This study was approved by the Ethics Committee, and all patients provided signed informed consent forms. The investigation adhered to the principles outlined in the Declaration of Helsinki.
PATIENTS:
The foot posture index designed by Redmond et al was used to evaluate foot posture [19]. Inclusion criteria were foot posture index score ≤5 (classified as normal foot type) and a score ≥6 (classified as flatfoot). Foot posture index was evaluated by 2 experienced assessors. Among patients with clubfoot with bilateral plantar flexion and varus deformity, X-rays showed that the longitudinal axis of the first metatarsal-talus and the fourth/fifth metatarsal-calcaneus formed an angle, and the angle between the longitudinal axis of talus and calcaneus was less than 30°. Lisfranc joint injuries were diagnosed by X-rays.
The exclusion criteria included a history of lower-limb injuries, surgery, and neurological disorders; diseases affecting the lower extremities, such as psoriatic arthritis and osteoarthritis; syndromic diseases, such as rheumatic immune disease and diabetes; a history of foot disease and treatment; and other congenital malformations.
Eventually, 30 individuals with healthy feet, 30 individuals with flatfoot, 30 individuals with clubfoot, and 50 patients with Lisfranc injury with matching age, sex, and height were included in the study (Table 1). Lisfranc injury comprises 5 types of fractures, and the difference in age, sex, height, and weight of various types of fractures was not significant (Table 2).
FOOT CT SCAN AND 3D MODEL CONSTRUCTION:
A finite element model was developed by obtaining foot CT images from participants using 64-channel spiral CT (General Electronics, Schenectady, NY). MRI scan can also be used for finite element modeling, but CT scan was selected in this study as it is superior for bone fracture and muscle deformities. The participants were in the supine position and stood still, the human body model under the examination area was calibrated, and the scanning bed was adjusted so that the scanning area was at the center of the scan. CT scan was performed in the sequential mode (120 kV, 125 mA, 1-mm layer thickness), and coronal (Figure 1A), cross-sectional (Figure 1B), and sagittal (Figure 1C) images of the foot were obtained. DICOM format foot CT images were obtained and imported into the medical image processing software Mimicsl 7.0 (Materialise, Leuven, Belgium) for 3D reconstruction and segmentation (Figure 1D). Finally, a total of 28 foot bones (7 tarsal, 5 metatarsal, 14 phalanges, distal tibia, and fibula segments) and soft tissue were used in the geometric model of the foot bone. The CT scan images of the feet, bone surface boundaries, and soft tissues were segmented. Information on the constructed foot bones was saved in STL and IGES format for later processing. Then, a point cloud model was generated, repaired, and optimized using reverse engineering software Geomagic Studio 2012 (Raindrop Geomagic, Research Triangle Park, NC, USA).
CONSTRUCTION OF 3D SOLID MODEL OF FOOT BONES:
The 3D solid model of foot bone was constructed by SolidWorks 2017 (Dassault Systemes SolidWorks Corp., Waltham, MA). The IGES format file was imported into SolidWorks, and solid bone boundaries and soft tissues were constructed. The cartilage layer with 1–2 mm thickness was established on the surface of the solid bone joint, and the 3D model of the foot with articular cartilage was obtained (Figure 2).
MESH GENERATION:
A total of 28 foot bones with distal segments of the tibia and fibula and 30 cartilages and soft tissue models in IGES format were imported into the finite element software ABAQUS (version 6.14, Dassault Systèmes Technologies, Providence, RI). Constructing the mesh model of the ankle and foot requires consideration of surface-to-surface contact, which includes contact surface of soft tissue and the support plate, contact surface of the ankle joint cartilage, and contact surface of the metatarsal joint cartilage. The plantar mesh and the articular cartilage mesh should be encrypted to improve accuracy and convergence. Bones were divided according to size, and the tibia and fibula were divided into cortical and cancellous bones. The mesh sizes were as follows: sole, 3 mm; ankle articular cartilage; 1.5 mm; metatarsal joint cartilage, 0.8 mm and bone, 1–2 mm; and peripheral soft tissue, 4.5 mm (Figure 3A, 3B). For mesh generation, tetrahedral meshing elements (C3D8R) were used in this study [20].
CONSTRUCTION OF THE LIGAMENT AND PLANTAR FASCIA:
Plantar fascia, also known as plantar aponeurosis, originates from the medial tubercle of the calcaneus and runs forward to insert into the metatarsal head [21]. According to the characteristics of the anatomical structure of foot ligaments, combined with the 3D anatomical information on foot ligaments via a 3Dbody anatomical platform, a total of 102 foot ligaments and 20 ligaments in the ankle joint, the lower tibiofibular joint, and the interosseous membrane of the lower leg were considered and constructed. The plantar fascia and the other main ligaments were simulated by selecting the spring element between 2 nodes in ABAQUS (Figure 3C). Damping coefficients were not considered when setting material properties, while stiffness was not considered when compressing.
MATERIAL PROPERTIES OF VARIOUS TISSUE STRUCTURES:
In finite element modeling, the major concern is accurate measurement and assessment of the geometric and mechanical properties of various components [22]. However, obtaining accurate parameters in vivo is difficult; thus, mechanical properties were assigned generally in finite element models from in vitro studies or previous studies. In the present study, related material properties were obtained from previous studies [23–25]. Bones, cartilage, ligaments, and ground supports were assumed to be isotropic, homogeneous, and linear. The effective Young’s modulus, Poisson’s ratio, and stiffness are shown in Table 3.
The encapsulated soft tissue was regarded as nonlinearly hyperelastic. Stress/strain analysis of the soft tissue was adopted from a previous investigation [26]. The coefficients of the hyperelastic model of the encapsulated soft tissue were 0.08556 (C10), −0.05841 (C01), 0.03900 (C20), −0.02310(C11), 0.00851 (C02), 3.65273 (D1), and 0.00000 (D2).
BOUNDARIES AND LOAD:
The intrinsic structure and complex dynamic tissues of the foot can absorb vibration when walking on the foot and provide stability in body movement and in pushing the body forward. The interaction between the musculoskeletal systems of the foot is complex. Therefore, the stance phase of the gait cycle was selected to simulate and analyze the model. Walking was used to validate the finite element model of foot tread. In the stance phase, several external muscles of the foot play an important role. In the present study, the external muscle force used in the walking simulation experiments by Sharkey and Hamel was used to determine the muscle groups and muscle force values under the typical posture of stance phase of finite element model simulation gait [23–25]. At the same time, the size range of plantar reaction force in the stance phase was preliminarily set according to the plantar reaction curve [27].
The simulation was according to Saint-Venant principle. The muscle force was applied evenly to the corresponding nodes, and the direction of muscle force was determined according to the corresponding anatomical degree of muscle strength. Plantar reaction was simulated by the continuous upward displacement of the supporting plate, and the joint of the soft tissue tibia and the upper end of the fibula in the model was completely fixed (Figure 3D).
This model involves the contact between joints, sole, and support plate. Two contact rules were set in the simulation analysis. The normal contact rule was set as the exponential permeability relationship, the tangential contact rule was set as the Coulomb friction rule [27], and friction coefficient was set to 0.01 and 0.6 [28]. In addition, the contact between foot bones and peripheral soft tissues was set as the binding contact.
STATISTICAL ANALYSIS:
All experiments were analyzed by SPSS20.0. The Mann-Whitney U test was used for nonnormally distributed variables (Figure 4A [Flatfoot/Clubfoot/second, third and fourth metatarsal dislocation vs healthy foot], Figure 4B, 4C [Flatfoot/Clubfoot/first metatarsal fracture vs healthy foot], Figure 4D, 4F [Clubfoot vs healthy foot]). Data with normal distribution were analyzed using one-way ANOVA (Tables 1, 2 and Figure 4E, 4G, and comparison between other groups in Figure 4A, 4C, 4F [Except for Mann-Whitney U test groups]). The chi-square test was used for enumeration data. Data are presented as mean±standard deviation or the number and percentage (%). P<0.05 was considered as a significant difference.
Results
PARTICIPANT CHARACTERISTICS:
The participants’ characteristics are shown in Table 2. The differences in sex, age, and height among the normal foot, flatfoot, clubfoot, and Lisfranc injury groups were not significant (P=0.91, P=0.81, P=0.089, and P=0.10, respectively). However, the difference in weight was significant (P<0.001).
STRESS DISTRIBUTION IN FOOT MODEL:
The obtained foot models were used to simulate peak instep pressure at the stance stage. The equivalent of von Mises stress contour map is shown at the top of the bony parts of the foot (Figure 5). In healthy feet, the von Mises stress was mostly concentrated on the lateral metatarsal, talus, and navicular bones (Figure 6A). In the fourth metatarsal, the maximum average stress reached 5.41 MPa. In flatfoot, the von Mises stress values were high in the metatarsals, talus, and navicular bones (Figure 6B). The maximum average stress in the fourth metatarsal was 10.31 MPa. The von Mises stress was mainly concentrated on the talus bone in the clubfoot group (Figure 6C), and the maximum average stress reached 8.59 MPa. The equivalent von Mises stress contour map revealed that the stress of the first metatarsal was reduced in patients with first metatarsal fracture (Figure 6D), and the maximum average stress was only 0.61 MPa. Besides, the talus bone had the highest average stress of 8.40 MPa, followed by the fourth metatarsal (6.43 MPa). Among patients with second, third, and fourth metatarsal dislocation, the von Mises stress was mainly concentrated on the fourth and fifth metatarsals and the talus bone (Figure 6E), and the maximum average stress was 6.20, 6.84, and 8.48, respectively. The von Mises stress was mainly concentrated on the fourth metatarsal, navicular, and talus bones in patients with second to fifth metatarsal dislocations (Figure 6F), and the maximum average stress was 5.56, 6.12, and 9.81 MPa, respectively. Among patients with second metatarsal fracture and third to fifth metatarsal dislocation, the von Mises stress was mainly concentrated on the third metatarsal, navicular, and talus bones (Figure 6G), and the maximum average stress was 4.73, 6.70, and 9.91 MPa, respectively. The von Mises stress was mainly concentrated on the fourth metatarsal, navicular, and talus bones among patients with medial cuneiform fracture and second and third metatarsal dislocation (Figure 6H). The maximum average stress was 6.63, 5.45, and 8.70 MPa, respectively. The maximum average stress of the 3D finite element modeling is shown in Figure 6.
Thereafter, the von Mises stress of the various types of foot bones was compared (Figure 4). The model of healthy feet predicted that the regions with high von Mises stress were the lateral metatarsals, talus, and navicular bones. In the flatfoot group, the von Mises stress was significantly higher in the metatarsals and the navicular and talus bones compared with the healthy feet (P<0.05), especially for the first and second metatarsal, in which stress increased by approximately threefold. In addition, the maximum von Mises stress was observed in flatfoot at the fourth metatarsal, which was the highest value among all measured foot types and bones. The clubfoot group showed varus, which is characterized by fixed plantar flexion. This group also showed the lowest von Mises stress values in the third to fifth metatarsal and navicular bones (P<0.05). However, the modeling prediction result showed that the von Mises stress was significantly increased in the talus and with no significant change in the first and second metatarsals. This result indicates that plantar flexion caused decreased stress in the lateral foot rather than in the medial foot and ankle.
The Lisfranc injuries included metatarsal fractures, dislocation, or medial cuneiform fracture. As shown in Figure 4, the von Mises stress in the first metatarsal was significantly decreased, whereas that in the second metatarsal, navicular, and talus bones was increased significantly in the first metatarsal fracture foot compared with healthy foot (P<0.05). In patients with second to fourth metatarsal dislocations, the von Mises stress in all bones was significantly increased except for the third and fourth metatarsals (P<0.05). In patients with second to fifth metatarsal dislocations, the von Mises stress in all bones was significantly increased except for the fourth and fifth metatarsals. Among the second metatarsal fracture with the third to fifth metatarsal dislocations, the von Mises stress of the second and fourth metatarsals was reduced significantly, whereas that of the first and third metatarsal, navicular, and talus bones was significantly increased. Among patients with medial cuneiform fracture with second and third metatarsal dislocations, the von Mises stress in the third and fifth metatarsals was not significantly changed compared with that of healthy foot (P>0.05). Stress in other bones was significantly increased (P<0.05). The results revealed that the von Mises stress of fractured bone was decreased, and that adjacent to the fractured bone tended to increase. When bone dislocation alone or fracture was accompanied by dislocation, the von Mises stress of the dislocated bone tended to be constant or increase rather than decrease.
Discussion
LIMITATIONS:
This study has several limitations. First, the anisotropic and nonlinear of the cortical and trabecular bones were not considered in material properties. Second, in different stance phases, the load-bearing characteristic of the foot should be combined with muscular loading. Third, in the future, the influence of soft tissue thickness, flexibility, and stiffening on plantar pressure and internal stress distribution should also be analyzed. Finally, various physiological load conditions should be simulated, and the finite element foot model should be improved to verify the experimental results.
Conclusions
This study aimed to use 3D finite element and biomechanical analyses of midfoot von Mises stress levels of flatfoot, clubfoot, and Lisfranc joint injury. The findings showed that the predicted von Mises stress distribution may be used clinically to evaluate the effects of deformity and injury on changes in structure and internal pressure distribution of the midfoot.
Figures
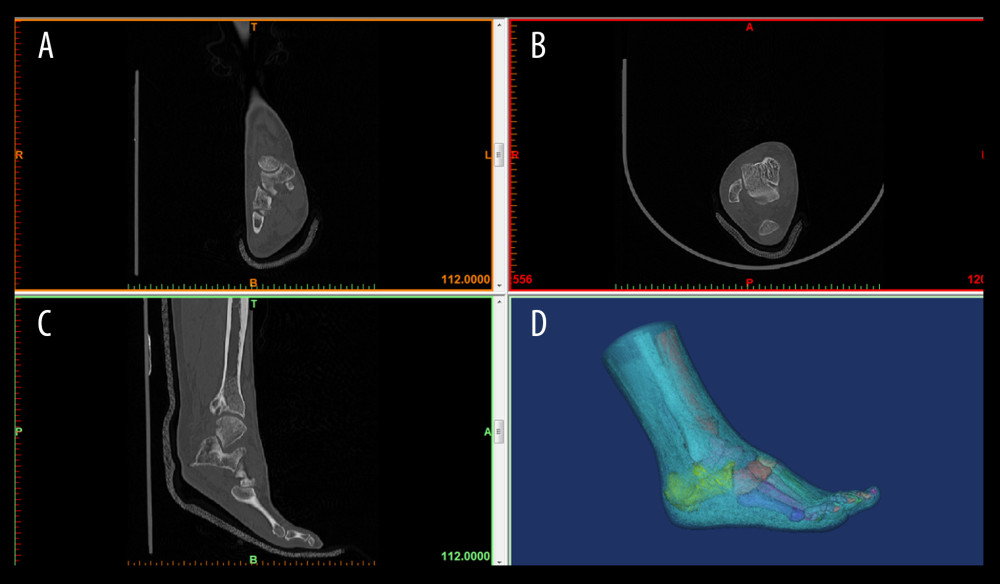 Figure 1. 3D foot reconstructionThe participants were in the supine position while standing still, and the computer tomography (CT) scan of 64-channel spiral was obtained in the sequential mode. Images were obtained and imported into medical image processing software Mimics 17.0 for 3D reconstruction. (A) coronal CT image; (B) transverse CT image; (C) sagittal CT image; and (D) foot reconstruction.
 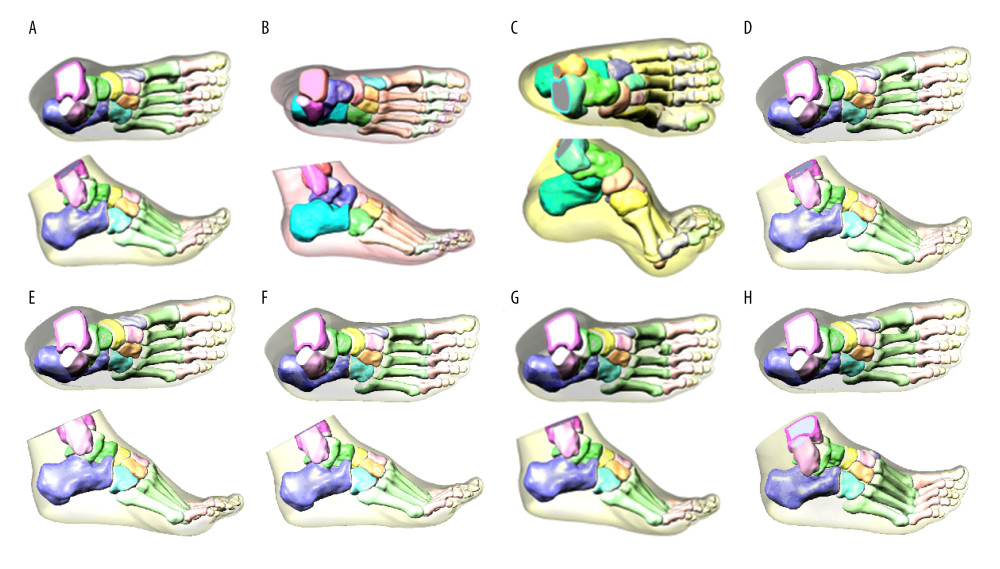 Figure 2. 3D finite element model of healthy foot, flatfoot, clubfoot, and foot with Lisfranc joint injuryA 3D solid model of foot bone was constructed by SolidWorks 2017 software, and the cartilage layer with a thickness of 1–2 mm was established on bone joint to obtain finite element model. (A) Healthy foot; (B) flatfoot; (C) clubfoot; (D) the first metatarsal fracture; (E) the second to fourth metatarsal dislocation; (F) the second to fifth metatarsal dislocation; (G) the second metatarsal fracture combined with the third to fifth metatarsal dislocation; and (H) the medial cuneiform fracture combined with second and third metatarsal dislocation.
 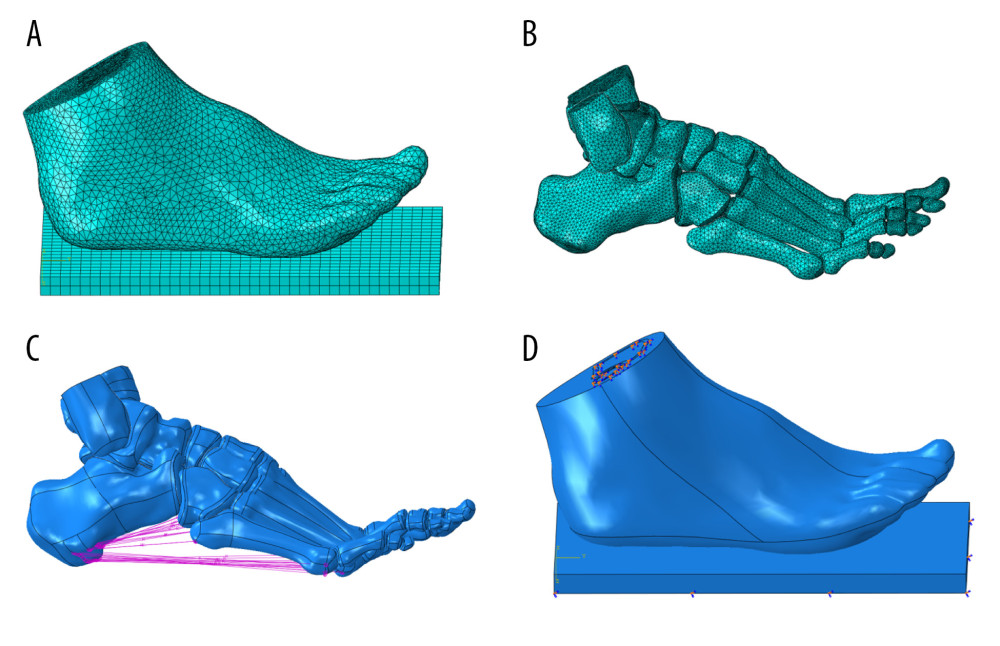 Figure 3. Encapsulated soft tissue, bone, and ligament construction and plantar contact area of the finite element foot modelThe models of soft tissue, cartilage, bone, and ligament were imported into ABAQUS software to simulate the foot model. Then, plantar response in the stance phase was simulated by fixing soft tissue of the tibia and fibula. (A) Grid size chart of encapsulated soft tissue; (B) grid size chart of the bone tissue; (C) schematic diagram of foot ligament; and (D) diagram of model contact area in stance phase.
 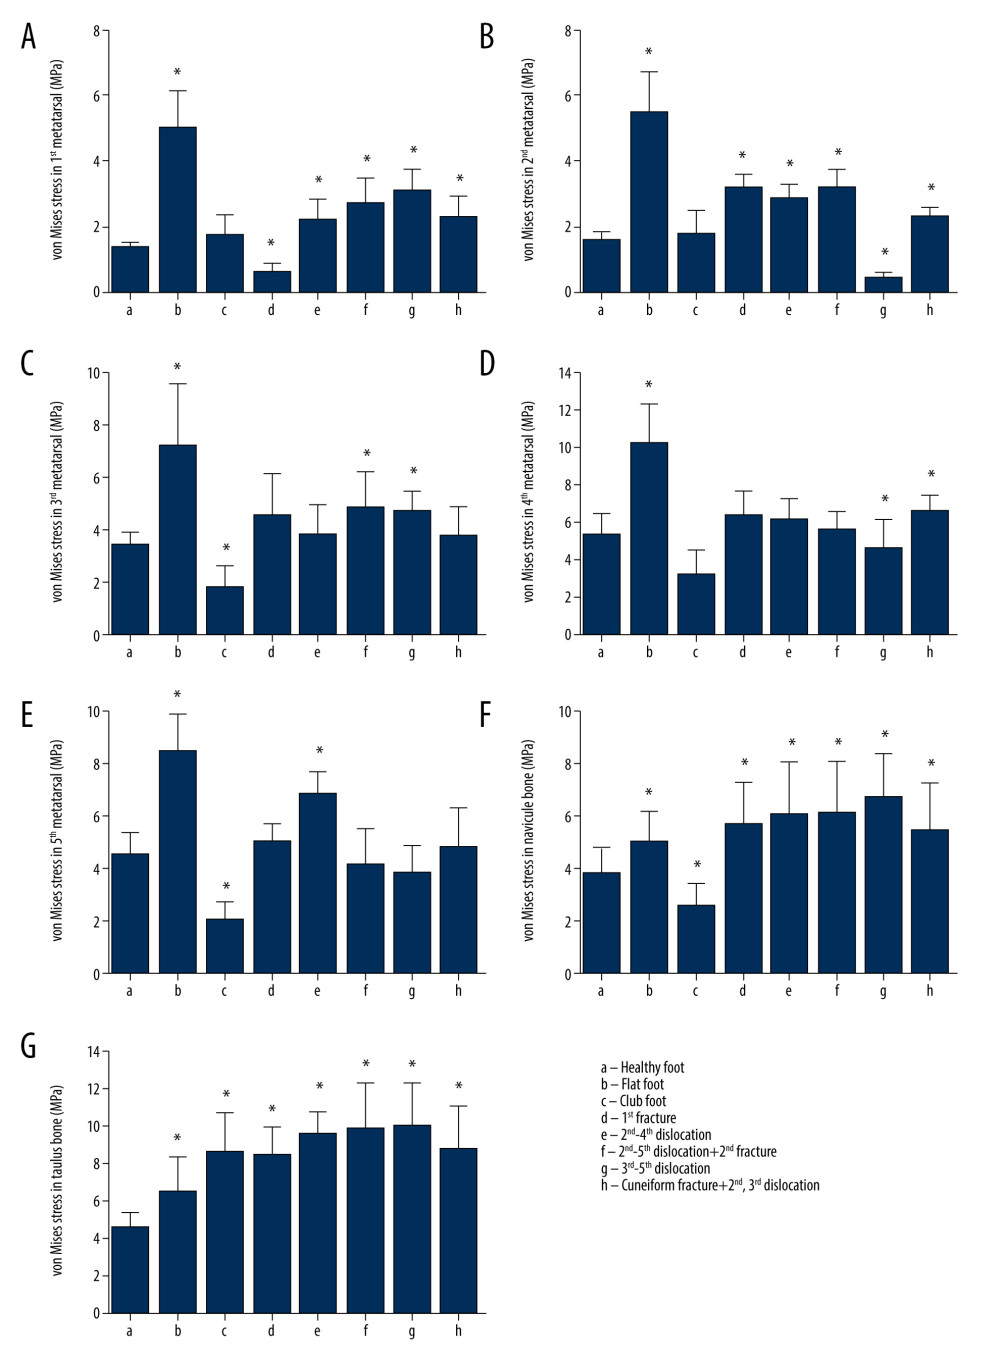 Figure 4. Comparison of the von Mises stress in the metatarsal, talus, and navicular bones in healthy foot, flatfoot, clubfoot, and foot with Lisfranc joint injury(A) The first metatarsal stress difference; (B) the second metatarsal stress difference; (C) the third metatarsal stress difference; (D) the fourth metatarsal stress difference; (E) the fifth metatarsal stress difference; (F) the talus stress difference; and (G) the Navicular stress difference. All data are presented as the mean±standard deviation, * p<0.05. The one-way ANOVA test or Mann-Whitney U test was used, two-sided.
 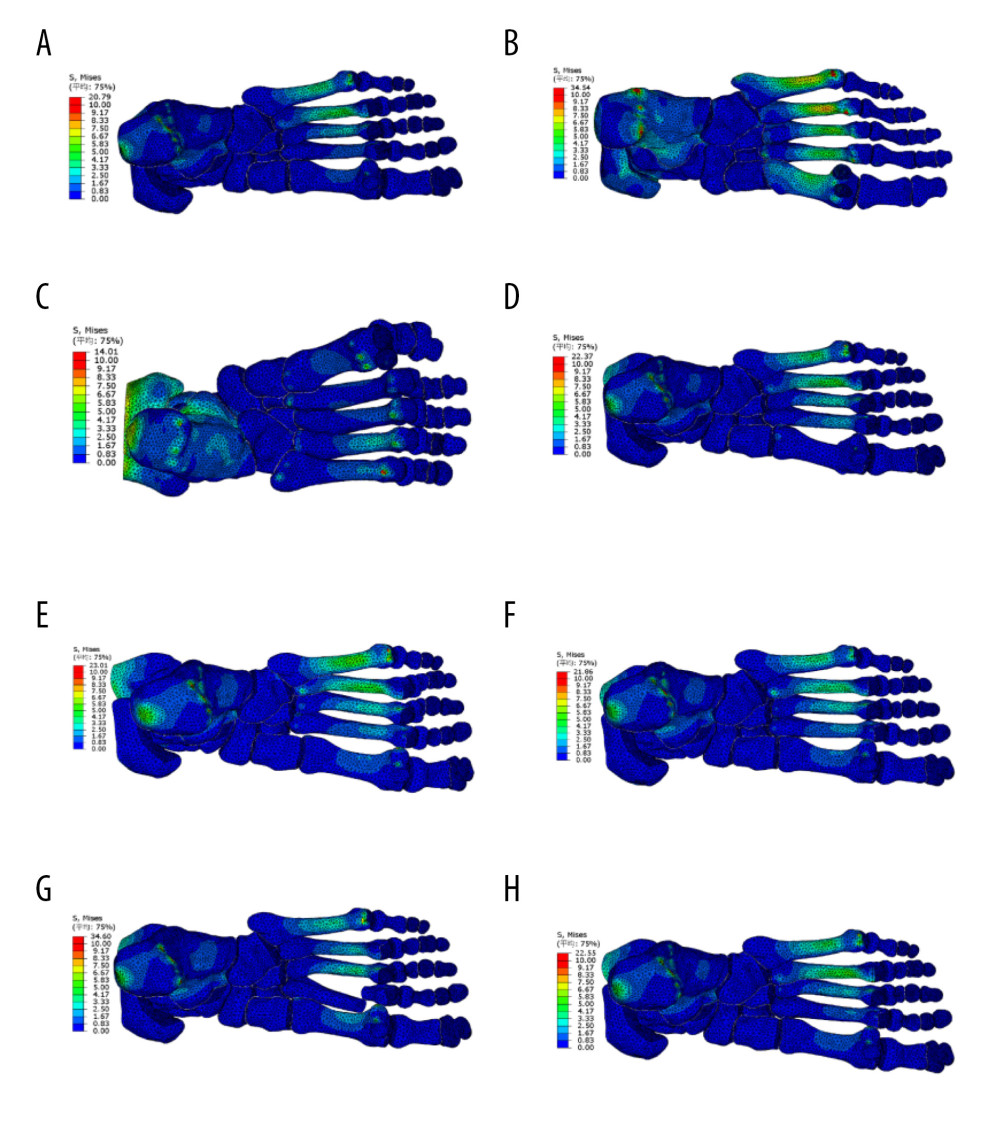 Figure 5. Distribution of von Mises stress in healthy foot, flatfoot, clubfoot, and foot with Lisfranc joint injuryABAQUS software was used to analyze the von Mises stress distribution of the finite element model in the stance stage. (A) Healthy foot; (B) flatfoot; (C) clubfoot; (D) the first metatarsal fracture; (E) the second to fourth metatarsal dislocation; (F) the second to fifth metatarsal dislocation; (G) the second metatarsal fracture combined with the third to fifth metatarsal dislocation; and (H) the medial cuneiform fracture combined with second and third metatarsal dislocation.
 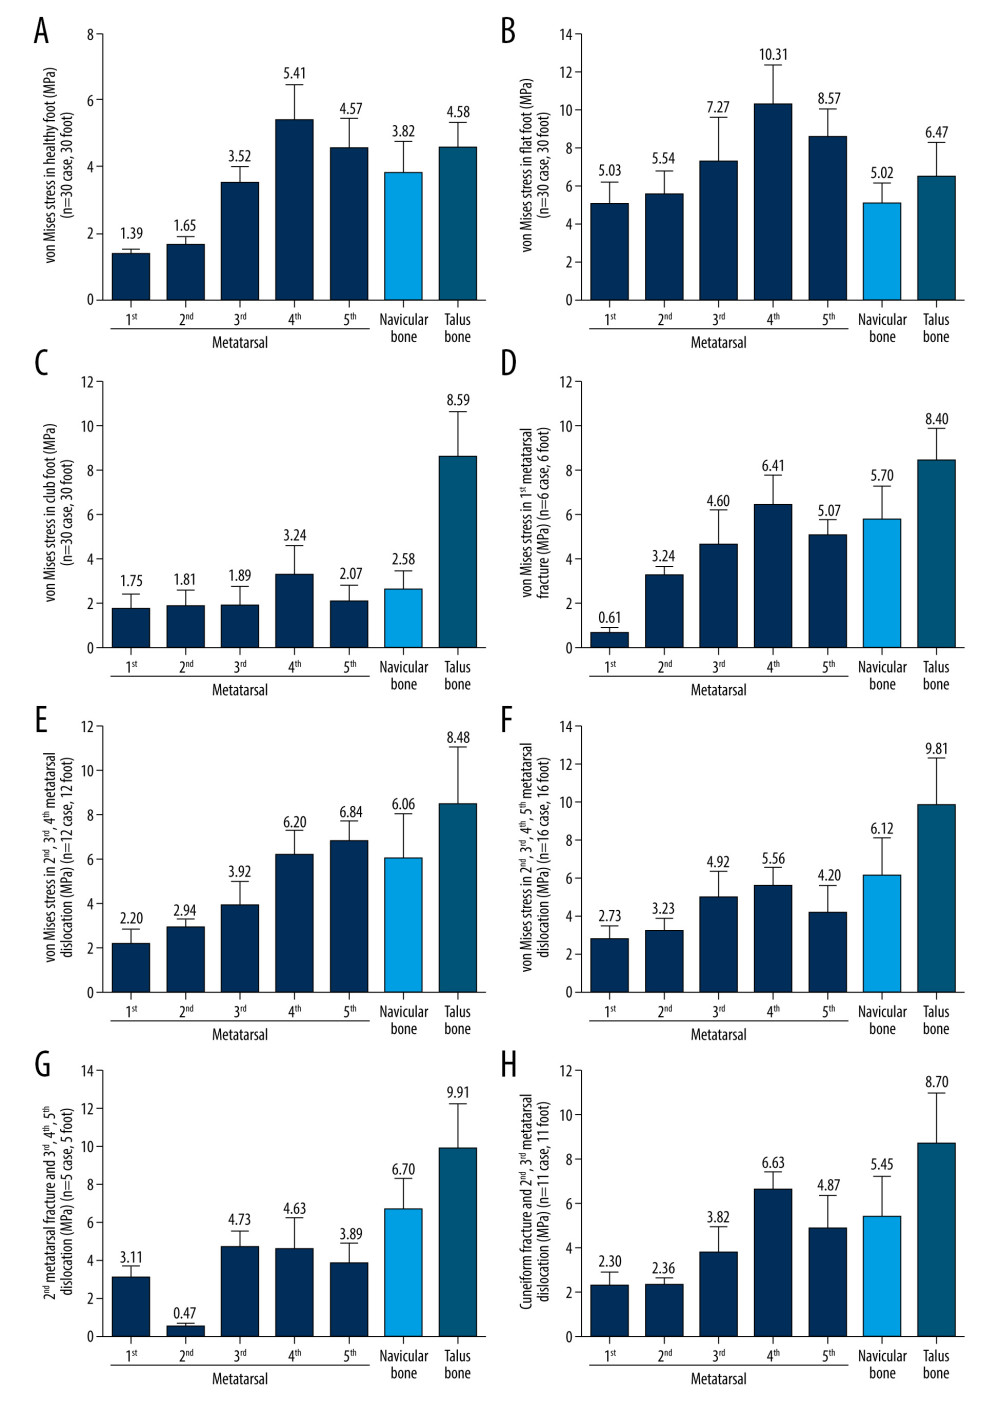 Figure 6. Von Mises stress of the metatarsal, talus, and navicular bones in healthy foot, flatfoot, clubfoot, and foot with Lisfranc joint injury(A) The stress distribution in healthy foot; (B) flatfoot; (C) clubfoot; (D) the first Metatarsal fracture; (E) the second to fourth metatarsal dislocation; (F) the second to fifth metatarsal dislocation; (G) the second metatarsal fracture combined with the third to fifth metatarsal dislocation; and (H) the medial cuneiform fracture combined with second and third metatarsal dislocation. All data are presented as the mean±standard deviation.
 References
1. Brockett CL, Chapman GJ, Biomechanics of the ankle: Orthop Trauma, 2016; 30(3); 232-38
2. Donatelli R, Normal biomechanics of the foot and ankle: J Orthop Sports Phys Ther, 1985; 7(3); 91-95
3. Burg J, Peeters K, Natsakis T, In vitro analysis of muscle activity illustrates mediolateral decoupling of hind and mid foot bone motion: Gait Posture, 2013; 38(1); 56-61
4. Pearce CJ, Calder JD, Surgical anatomy of the midfoot: Knee Surg Sports Traumatol Arthrosc, 2010; 18(5); 581-86
5. Jeong H-J, Sohn IW, Kim D, Impact of midfoot and Hindfoot involvement on functional disability in Korean patients with rheumatoid arthritis: BMC Musculoskeletal Disord, 2017; 18(1); 365
6. Doherty C, Delahunt E, Caulfield B, The incidence and prevalence of ankle sprain injury: A systematic review and meta-analysis of prospective epidemiological studies: Sports Med, 2014; 44(1); 123-40
7. Shibuya N, Davis ML, Jupiter DC, Epidemiology of foot and ankle fractures in the United States: An analysis of the National Trauma Data Bank (2007 to 2011): J Foot Ankle Surg, 2014; 53(5); 606-8
8. Zhou J, Guo PFinite element analysis on foot based on Abaqus: Computer Aided Engineering, 2013; 22(S2); 428-31 [in Chinese]
9. Babu D, Bordoni B, Anatomy, bony pelvis, lower limb. Medial longitudinal arch of the foot: StatPearls [Internet], 2021, Treasure Island (FL), StatPearls Publishing
10. Mun KR, Chun S, Hong J, Kim J, The relationship between foot feature parameters and postural stability in healthy subjects: Hum Factors, 2019; 61(7); 1077-85
11. Filardi V, Flatfoot and normal foot a comparative analysis of the stress shielding: J Orthop, 2018; 15(3); 820-25
12. Gozar H, Derzsi Z, Chira A, Finite-element-based 3D computer modeling for personalized treatment planning in clubfoot deformity: Case report with technique description [J]: Medicine (Baltimore), 2018; 97(24); e11021
13. Chen WM, Lee T, Lee PVS, Effects of internal stress concentrations in plantar soft-tissue-a preliminary three-dimensional finite element analysis: Med Eng Phys, 2010; 32(4); 324-31
14. Filardi V, Tibio talar contact stress: An experimental and numerical study: J Orthop, 2019; 17; 44-48
15. Wang Y, Li Z, Zhang M, Biomechanical study of tarsometatarsal joint fusion using finite element analysis: Med Eng Phys, 2014; 36(11); 1394-400
16. Larrainzar-Garijo R, Cifuentes de la Portilla C, Gutiérrez-Narvarte B, Effect of the calcaneal medializing osteotomy on soft tissues supporting the plantar arch: A computational study: Rev Esp Cir Ortop Traumatol, 2019; 63(2); 155-63
17. Tsubone T, Toba N, Tomoki U, Prediction of fracture lines of the calcaneus using a three-dimensional finite element model: J Orthop Res, 2019; 37(2); 483-89
18. Wang Y, Li Z, Wong DW, Zhang M, Effects of ankle arthrodesis on biomechanical performance of the entire foot: PLoS One, 2015; 10(7); e0134340
19. Redmond AC, Crane YZ, Menz HB, Normative values for the Foot Posture Index: J Foot Ankle Res, 2008; 1(1); 6
20. Tadepalli SC, Erdemir A, Cavanagh PR, Comparison of hexahedral and tetrahedral elements in finite element analysis of the foot and footwear: J Biomech, 2011; 44(12); 2337-43
21. Young C, Plantar fasciitis: Ann Intern Med, 2012; 156(1 Part 1); ITC1-1
22. Ou H, Qaiser Z, Kang L, Johnson S, Effect of skin on finite element modeling of foot and ankle during balanced standing: Journal of Shanghai Jiaotong University (Science), 2018; 23(1); 132-37 [in Chinese]
23. Gefen A, Megido-Ravid M, Itzchak Y, Arcan M, Biomechanical analysis of the three-dimensional foot structure during gait: A basic tool for clinical applications: J Biomech Eng, 2000; 122(6); 630-39
24. Nakamura S, Crowninshield RD, Cooper RR, An analysis of soft tissue loading in the foot-a preliminary report: Bull Prosthet Res, 1981; 10-35; 27-34
25. Athanasiou KA, Liu GT, Lavery LA, Biomechanical topography of human articular cartilage in the first metatarsophalangeal joint: Clin Orthop Relat Res, 1998(348); 269-81
26. Lemmon D, Shiang T-Y, Hashmi A, The effect of insoles in therapeutic footwear – a finite element approach: J Biomech, 1997; 30(6); 615-20
27. Cakir H, Van Vliet-Koppert ST, Van Lieshout EM, Demographics and outcome of metatarsal fractures: Arch Orthop Trauma Surg, 2011; 131(2); 241-45
28. Richter M, Wippermann B, Krettek C, Fractures and fracture dislocations of the midfoot: Occurrence, causes and long-term results: Foot Ankle Int, 2001; 22(5); 392-98
29. Williams DS, McClay IS, Hamill J, Arch structure and injury patterns in runners: Clin Biomech (Bristol, Avon), 2001; 16(4); 341-47
30. Dobbs MB, Gurnett CA, Update on clubfoot: Etiology and treatment: Clin Orthop Relat Res, 2009; 467(5); 1146-53
31. Kinoshita K, Okada K, Saito I, Alignment of the rearfoot and foot pressure patterns of individuals with medial tibial stress syndrome: A cross-sectional study: Phys Ther Sport, 2019; 38; 132-38
32. Kido M, Ikoma K, Imai K, Load response of the tarsal bones in patients with flatfoot deformity: In vivo 3D study: Foot Ankle Int, 2011; 32(11); 1017-22
33. Kido M, Ikoma K, Imai K, Load response of the medial longitudinal arch in patients with flatfoot deformity: In vivo 3D study: Clin Biomech (Bristol, Avon), 2013; 28(5); 568-73
34. Li SJ, Tang L, Zhao L, Effect of Achilles tendon on kinematic coupling relationship between tarsal bones: A pilot finite element study: J Orthop Surg Res, 2020; 15(1); 210
35. Ponseti IV, Smoley EN, The classic: Congenital club foot: The results of treatment 1963: Clin Orthop Relat Res, 2009; 467(5); 1133-45
36. Gefen A, Biomechanical analysis of fatigue-related foot injury mechanisms in athletes and recruits during intensive marching: Med Biol Eng Comput, 2002; 40(3); 302-10
37. Bayod J, Becerro-de-Bengoa-Vallejo R, Losa-Iglesias ME, Doblaré M, Mechanical stress redistribution in the calcaneus after autologous bone harvesting: J Biomech, 2012; 45(7); 1219-26
38. Cheung JT, Zhang M, An KN, Effects of plantar fascia stiffness on the biomechanical responses of the ankle-foot complex: Clin Biomech (Bristol, Avon), 2004; 19(8); 839-46
39. Anderson RT, Pacaccio DJ, Yakacki CM, Carpenter RD, Finite element analysis of a pseudoelastic compression-generating intramedullary ankle arthrodesis nail: J Mech Behav Biomed Mater, 2016; 62; 83-92
40. Wong DW, Niu W, Wang Y, Zhang M, Finite element analysis of foot and ankle impact injury: Risk evaluation of calcaneus and talus fracture: PLoS One, 2016; 11(4); e0154435
41. Hsu YC, Gung YW, Shih SL, Using an optimization approach to design an insole for lowering plantar fascia stress – a finite element study: Ann Biomed Eng, 2008; 36(8); 1345-52
42. Naderi A, Degens H, Sakinepoor A, Arch-support foot-orthoses normalize dynamic in-shoe foot pressure distribution in medial tibial stress syndrome: Eur J Sport Sci, 2019; 19(2); 247-57
43. Su S, Mo Z, Guo J, Fan Y, The effect of arch height and material hardness of personalized insole on correction and tissues of flatfoot: J Healthc Eng, 2017; 2017; 8614341
44. Scarton A, Guiotto A, Malaquias T, A methodological framework for detecting ulcers’ risk in diabetic foot subjects by combining gait analysis, a new musculoskeletal foot model and a foot finite element model: Gait Posture, 2018; 60; 279-85
Figures
Figure 1. 3D foot reconstructionThe participants were in the supine position while standing still, and the computer tomography (CT) scan of 64-channel spiral was obtained in the sequential mode. Images were obtained and imported into medical image processing software Mimics 17.0 for 3D reconstruction. (A) coronal CT image; (B) transverse CT image; (C) sagittal CT image; and (D) foot reconstruction.Figure 2. 3D finite element model of healthy foot, flatfoot, clubfoot, and foot with Lisfranc joint injuryA 3D solid model of foot bone was constructed by SolidWorks 2017 software, and the cartilage layer with a thickness of 1–2 mm was established on bone joint to obtain finite element model. (A) Healthy foot; (B) flatfoot; (C) clubfoot; (D) the first metatarsal fracture; (E) the second to fourth metatarsal dislocation; (F) the second to fifth metatarsal dislocation; (G) the second metatarsal fracture combined with the third to fifth metatarsal dislocation; and (H) the medial cuneiform fracture combined with second and third metatarsal dislocation.Figure 3. Encapsulated soft tissue, bone, and ligament construction and plantar contact area of the finite element foot modelThe models of soft tissue, cartilage, bone, and ligament were imported into ABAQUS software to simulate the foot model. Then, plantar response in the stance phase was simulated by fixing soft tissue of the tibia and fibula. (A) Grid size chart of encapsulated soft tissue; (B) grid size chart of the bone tissue; (C) schematic diagram of foot ligament; and (D) diagram of model contact area in stance phase.Figure 4. Comparison of the von Mises stress in the metatarsal, talus, and navicular bones in healthy foot, flatfoot, clubfoot, and foot with Lisfranc joint injury(A) The first metatarsal stress difference; (B) the second metatarsal stress difference; (C) the third metatarsal stress difference; (D) the fourth metatarsal stress difference; (E) the fifth metatarsal stress difference; (F) the talus stress difference; and (G) the Navicular stress difference. All data are presented as the mean±standard deviation, * p<0.05. The one-way ANOVA test or Mann-Whitney U test was used, two-sided.Figure 5. Distribution of von Mises stress in healthy foot, flatfoot, clubfoot, and foot with Lisfranc joint injuryABAQUS software was used to analyze the von Mises stress distribution of the finite element model in the stance stage. (A) Healthy foot; (B) flatfoot; (C) clubfoot; (D) the first metatarsal fracture; (E) the second to fourth metatarsal dislocation; (F) the second to fifth metatarsal dislocation; (G) the second metatarsal fracture combined with the third to fifth metatarsal dislocation; and (H) the medial cuneiform fracture combined with second and third metatarsal dislocation.Figure 6. Von Mises stress of the metatarsal, talus, and navicular bones in healthy foot, flatfoot, clubfoot, and foot with Lisfranc joint injury(A) The stress distribution in healthy foot; (B) flatfoot; (C) clubfoot; (D) the first Metatarsal fracture; (E) the second to fourth metatarsal dislocation; (F) the second to fifth metatarsal dislocation; (G) the second metatarsal fracture combined with the third to fifth metatarsal dislocation; and (H) the medial cuneiform fracture combined with second and third metatarsal dislocation. All data are presented as the mean±standard deviation. Tables
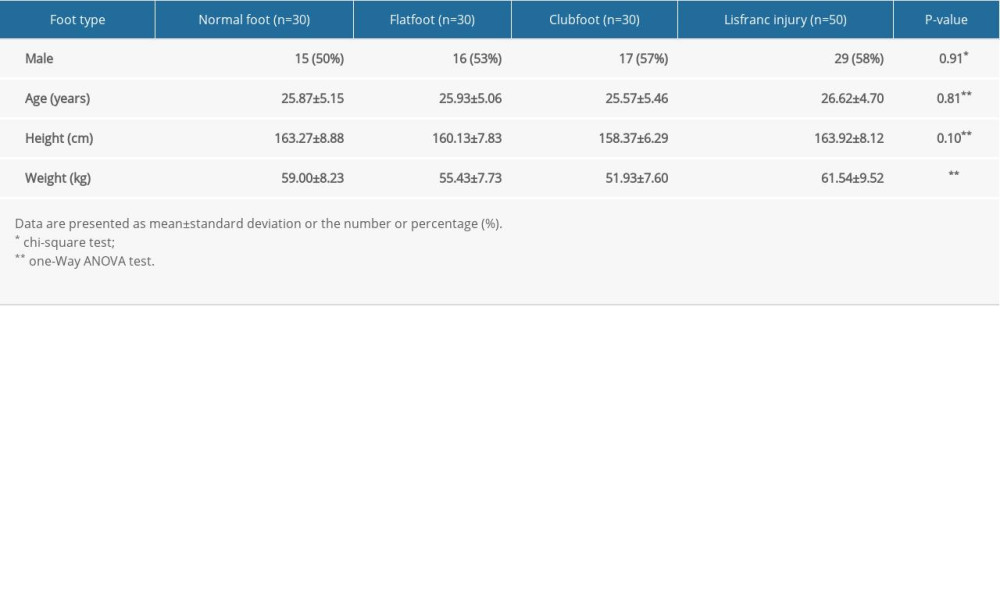 Table 1. The characteristics of participants.
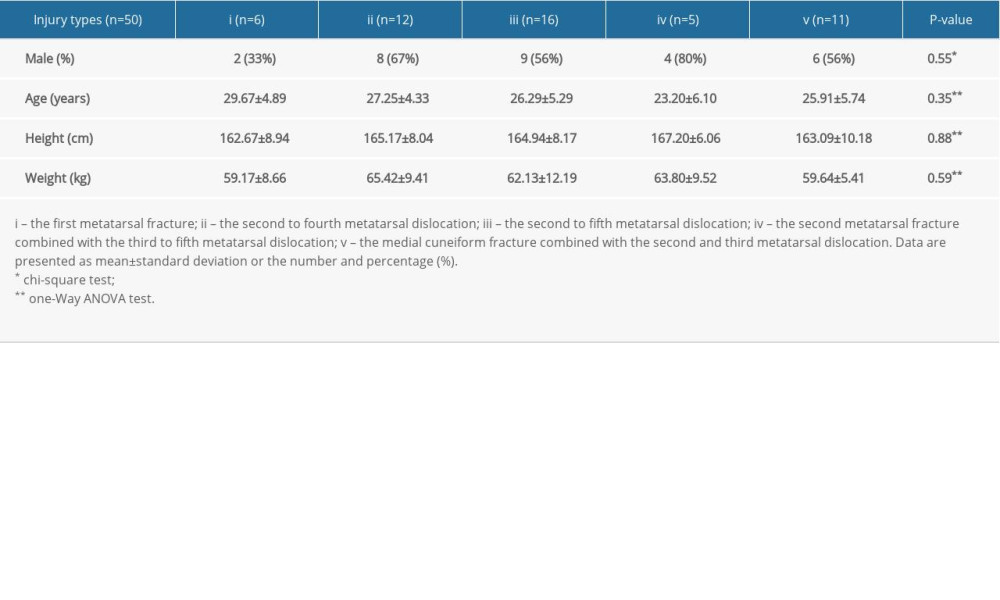 Table 2. The characteristics of Lisfranc injury patients.
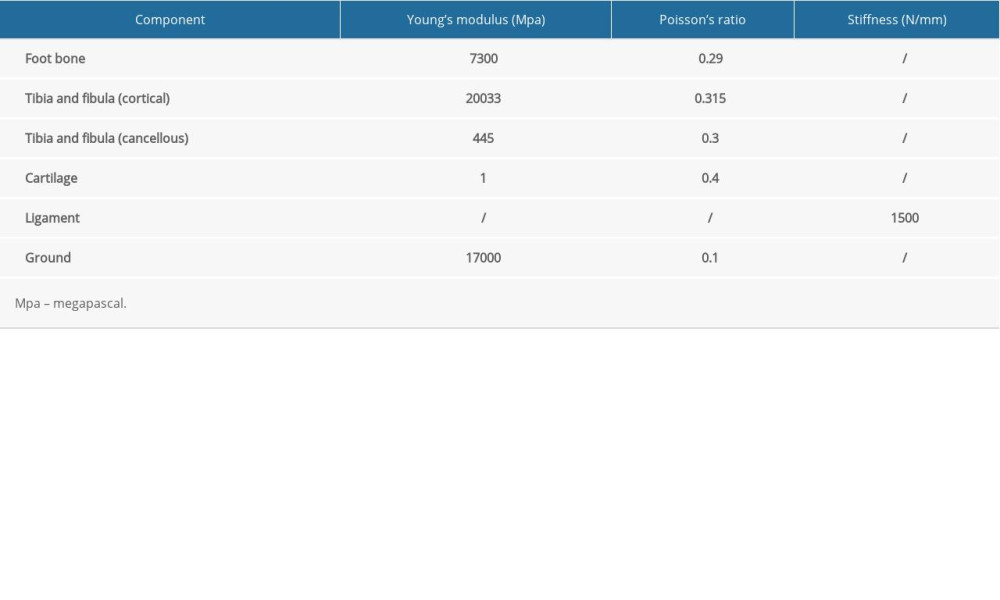 Table 3. The mechanical properties of finite element model.Table 1. The characteristics of participants.Table 2. The characteristics of Lisfranc injury patients.Table 3. The mechanical properties of finite element model.
 In Press
06 Mar 2024 : Clinical Research
Comparison of Outcomes between Single-Level and Double-Level Corpectomy in Thoracolumbar Reconstruction: A ...Med Sci Monit In Press; DOI: 10.12659/MSM.943797
21 Mar 2024 : Meta-Analysis
Economic Evaluation of COVID-19 Screening Tests and Surveillance Strategies in Low-Income, Middle-Income, a...Med Sci Monit In Press; DOI: 10.12659/MSM.943863
10 Apr 2024 : Clinical Research
Predicting Acute Cardiovascular Complications in COVID-19: Insights from a Specialized Cardiac Referral Dep...Med Sci Monit In Press; DOI: 10.12659/MSM.942612
06 Mar 2024 : Clinical Research
Enhanced Surgical Outcomes of Popliteal Cyst Excision: A Retrospective Study Comparing Arthroscopic Debride...Med Sci Monit In Press; DOI: 10.12659/MSM.941102
Most Viewed Current Articles
17 Jan 2024 : Review article
Vaccination Guidelines for Pregnant Women: Addressing COVID-19 and the Omicron VariantDOI :10.12659/MSM.942799
Med Sci Monit 2024; 30:e942799
14 Dec 2022 : Clinical Research
Prevalence and Variability of Allergen-Specific Immunoglobulin E in Patients with Elevated Tryptase LevelsDOI :10.12659/MSM.937990
Med Sci Monit 2022; 28:e937990
16 May 2023 : Clinical Research
Electrophysiological Testing for an Auditory Processing Disorder and Reading Performance in 54 School Stude...DOI :10.12659/MSM.940387
Med Sci Monit 2023; 29:e940387
01 Jan 2022 : Editorial
Editorial: Current Status of Oral Antiviral Drug Treatments for SARS-CoV-2 Infection in Non-Hospitalized Pa...DOI :10.12659/MSM.935952
Med Sci Monit 2022; 28:e935952