03 June 2021: Clinical Research
Chest Computed Tomography (CT) as a Predictor of Clinical Course in Coronavirus Disease
Bartosz Mruk12ABCDEF*, Jerzy Walecki12ACDE, Andrzej Górecki- A Study design/planning
- B Data collection/entry
- E Preparation of manuscript
- F Literature analysis/search
DOI: 10.12659/MSM.931285
Med Sci Monit 2021; 27:e931285


Abstract
BACKGROUND: Chest imaging may be taken into consideration in detecting viral lung infections, especially if there are no tests available or there is a need for a prompt diagnosis. Imaging modalities enable evaluation of the character and extent of pulmonary lesions and monitoring of the disease course. The aim of this study was to verify the prognostic value of chest CT in COVID-19 patients.
MATERIAL AND METHODS: We conducted a retrospective review of clinical data and CT scans of 156 patients with SARS-CoV-2 infection confirmed by real-time reverse-transcription polymerase-chain-reaction (rRT-PCR) assay hospitalized in the Central Clinical Hospital of the Ministry of the Interior in Warsaw and in the Medical Centre in Łańcut, Poland. The total severity score (TSS) was used to quantify the extent of lung opacification in CT scans.
RESULTS: The dominant pattern in discharged patients was ground-glass opacities, whereas in the non-survivors, the dominant pulmonary changes were consolidations. The non-survivors were more likely to have pleural effusion, pleural thickening, lymphadenopathy, air bronchogram, and bronchiolectasis. There were no statistically significant differences among the 3 analyzed groups (non-survivors, discharged patients, and patients who underwent prolonged hospitalization) in the presence of fibrotic lesions, segmental or subsegmental pulmonary vessel enlargement, subpleural lines, air bubble sign, and halo sign.
CONCLUSIONS: Lung CT is a diagnostic tool with prognostic utility in COVID-19 patients. The correlation of the available clinical data with semi-quantitative radiological features enables evaluation of disease severity. The occurrence of specific radiomics shows a positive correlation with prognosis.
Keywords: COVID-19, Diagnostic Imaging, multidetector computed tomography, Aged, 80 and over, COVID-19, Pandemics, Pleural Effusion, Poland, Real-Time Polymerase Chain Reaction, SARS-CoV-2, Severity of Illness Index, Thorax, Tomography, X-Ray Computed
Background
The etiology, clinical symptoms and course, and diagnostic imaging findings of COVID-19 are similar to those of the last 2 coronavirus epidemics – severe acute respiratory syndrome (SARS) and Middle-East respiratory syndrome (MERS) – although there are also some significant differences [1,2].
The most common clinical symptoms of CVID-19 are cough, fever, fatigue and dyspnea, while muscle pain, sore throat, loss of smell, diarrhea, and mild cardiovascular symptoms are rarely reported [3–5]. Around 30% of SARS-CoV-2-positive patients never developed any clinical symptoms [6].
Complications associated with SARS-CoV-2 infection include: acute respiratory distress syndrome (ARDS), secondary infections including sepsis, acute kidney damage, acute heart damage, multiple organ failure, and death [7,8].
Among the most frequently found abnormalities in laboratory tests in patients with COVID-19 are leukopenia and lymphopenia, low procalcitonin level, increased inflammatory markers (CRP and ESR), prothrombin time, lactate dehydrogenase, creatinine kinase, and D-dimer level [9,10].
Evaluation of the character and extent of pulmonary lesions and monitoring of the progression/regression of the disease are based on chest imaging.
Chest X-ray may be the first-line imaging modality applied in patients with suspected COVID-19, despite of its low diagnostic value in the initial stages and in patients with a mild course of infection. In these patients, chest radiography results can be normal, but asymmetric patchy or diffuse airspace opacities can be observed [8,11].
In the later stages of the disease, chest radiographs may show progression to the signs of acute respiratory distress syndrome (ARDS) and can be useful in follow-up of the disease.
Chest imaging plays a major role in detecting viral lung infection, especially if there are no tests available or there is a need for prompt diagnosis. Imaging modalities enable evaluation of the character and extent of pulmonary lesions and monitoring of the disease course. Expected findings on chest radiograph (CRX) and CT in COVID-19 patients are those of atypical pneumonia or organizing pneumonia. The most commonly seen distribution pattern involves bilateral, peripheral, basal, and/or multilobar changes. Chest imaging shows limited sensitivity for COVID-19 in mild and/or early cases, as up to 18% of patients with mild disease or early in the disease course demonstrate a normal chest radiograph or CT, but this proportion decreases to 3% in severe cases [12].
CRX may be normal in the initial stages of COVID-19 and reveal asymmetric patchy or diffuse airspace opacities. The sensitivity of CRX is significantly lower in comparison to CT – 69% vs 91%, respectively, in one study [11].
In mild or early disease, CRX demonstrates normal image in 18% of cases, and this rate decreases to 3% in severe cases [8]. It also has limited value in quantitative analysis in terms of progression/regression.
The American College of Radiology Recommendations for the Use of Chest Radiography and Computed Tomography (CT) for Suspected COVID-19 Infection (11 March 2020) concluded that CXR did not improve the clinical outcomes (duration of illness) for patients with lower respiratory tract infection and CXR should be performed only if considered medically necessary [13].
Lung ultrasound (LUS) is very useful in the evaluation of critically ill COVID-19 patients, especially in cases where CT imaging cannot be performed. This is also a method of choice for repeated imaging in intensive care patients. Distribution of visible changes demonstrates a bilateral and posterobasal predominance. It has been reported that ultrasound shows multiple B-lines, pneumonic consolidations typically associated with preservation of flow or hyperemia, and irregular thickened pleural line with subpleural consolidations [14]. Although lung ultrasound was found to be a valuable imaging modality in the diagnostics of pneumonia (especially in patients with ARDS), the range of view is small [15]. Although LUS is not the recommended method for COVID-19 pneumonia imaging, it may be performed repeatedly without exposure to radiation. However, it requires a radiologist with experience in interpreting this kind of image in COVID-19 patients [16–20].
The features depicted in lung CTs are unspecific and may occur in atypical or organizing pneumonia. The most commonly reported findings include (Figures 1–5):
The distribution of pulmonary changes is usually bilateral, subpleural, and peripheral.
There are some studies indicating that CT might be a valuable tool in acute settings, showing some imaging characteristics. The most specific features were:
Pathologies seen in pulmonary CT scans undergo temporal changes [21,22]. CT manifestations can be divided into 4 stages [23]. Within the first 4 days (days 0–4) is regarded as the early stage, in which the CT result is normal or only slight GGOs are seen. Then, in the progressive stage (days 5–8) there are GGO and crazy paving. In the severe stage (days 9–13), there may be consolidations. In the regression stage (>14 days), there are fibrous stripes and gradual regression of symptoms.
CT plays an important role in the evaluation of disease severity. The methodology proposed by various groups is based on automatic or manual segmentation corresponding with the morphological structure of the lung, together with quantitative assessment of the involved lung. The involvement of the pulmonary parenchyma can be quantified automatically using segmentation software.
Application of a severity scale based on CT radiomics may have an impact on daily routine, as there is a need for efficient early detection based not only on time-consuming viral nucleic acid testing and prognosis of COVID-19 in patients with confirmed disease.
It has already been reported that patients with comorbidities such as chronic obstructive pulmonary disease, cardiovascular disease, hypertension, and the elderly are more prone to severe morbidity [24]. Identification of reliable models enabling the prognosis of COVID-19 infection outcomes in terms of progression to severe condition or death might assist in therapeutic decision-making.
CT scan sensitivity in COVID-19 is much higher than that of chest X-ray, at 91% vs 69%, respectively [11]. CT findings may be present before the onset of clinical symptoms in up to 54% of asymptomatic patients with COVID-19 [22,25,26]. The diagnostic value of CT findings has also been shown in cases with an initial false-negative result of reverse transcription polymerase chain reaction (RT-PCR) [27,28].
The aim of the study was to verify the prognostic value of chest CT in COVID-19 patients.
Material and Methods
We conducted a retrospective review of clinical data and CT scans of 156 consecutive patients with SARS-CoV-2 infection confirmed by real-time reverse-transcription polymerase-chain-reaction (rRT-PCR) assay of nasal and pharyngeal swab specimens, according to the World Health Organization guidance [29]. The abovementioned patients were hospitalized in the Central Clinical Hospital of the Ministry of the Interior in Warsaw and in the Medical Centre in Lancut, Poland.
Patients from these 2 institutions who underwent CT examinations within the first 7 days of hospitalization were included in the study and then classified into 3 groups depending on the following criteria: (1) patients who died, (2) patients discharged from hospital following 2 consecutive negative rRT-PCR tests, and (3) patients with prolonged hospital stay and virus shedding (over 3 weeks). The rest of the patients were excluded from the study.
CT scans were carried out on two 16-detector CT scanners, in supine position, during a single inspiratory breath-hold. The scanning range was from the apex of the lungs to the costophrenic angle. CT scan parameters were as follows: 80–120 KVp, 100 mAs, 1.2-mm slice thickness, and 1.2 pitch. CT scans were reviewed using a work station equipped with OsiriX MD v. 8.0.2 software at a window width and level of 1500 HU and −600 HU, respectively, for lung parenchyma.
We reviewed severity scoring systems applied to evaluate chest CT in COVID-19 patients [30]. We decided to use the Total Severity Score (TSS) proposed by Kunwei Li et al to quantify the extent of lung opacification [31]. According to this severity scale, each of the 5 lung lobes was assessed for percentage of lobar involvement and classified as none (0%), minimal (1–25%), mild (26–50%), moderate (51–75%), or severe (76–100%), with corresponding scores of 0, 1, 2, 3, or 4, respectively. The TSS was reached by adding the 5 lobe scores to each other (range from 0 to 20) [31]. We decided to modify the Total Severity Score (modified TSS) and to include additional qualitative features of lung involvement: (A) predominantly ground-glass opacities, (B) predominantly crazy paving pattern, (C) predominantly consolidations, and (X) other characteristics [30].
CT scans were assessed for the presence of ground-glass opacities, crazy paving pattern, and consolidations with the analysis of their peripheral or peribronchovascular distribution (or both). We also assessed each patient for the presence of air bronchogram, bronchiolectasis, air bubble, fibrotic lesions, reticular pattern, centrilobular nodules, halo sign, reverse halo sign, subpleural lines, pleural thickening (>2 mm), pleural effusion, segmental or subsegmental pulmonary vessel enlargement, and thoracic lymphadenopathy (>10 mm in short axis).
All CT scans were reviewed by 2 radiologists with 7 and 16 years of experience (B.M. and K.S., respectively). Imaging was assessed independently and disagreements were resolved by discussion and consensus.
The clinical status of all patients on the day of CT imaging was assessed using the “Modified Early Warning Score (MEWS)”, which includes measurements of systolic blood pressure, heart rate, respiratory rate, body temperature and level of consciousness [32] (Table 1). The choice of clinical status assessment was made relying upon the experience of physicians in collaborating hospitals.
Demographic data, clinical history, symptoms, and laboratory findings at hospital admission were extracted from electronic medical records.
In statistical data analysis, the chi-square test and the H Kruskal-Wallis test were applied. All calculations were performed using Statistica v. 13.3 software.
The study was approved by the Ethics Committee of the Central Clinical Hospital of the Ministry of the Interior.
Results
Out of 156 patients (at a mean age of 56.7 years; range 28–92 years old) included in the study, 67 (42.9%) were females and 89 (57.1%) were males. Fifteen died (referred to as ‘non-survivors’), 85 were discharged within 3 weeks (referred to as ‘discharged patients’), and 56 were hospitalized with viral shedding longer than 3 weeks (referred to as ‘patients who underwent prolonged hospitalization’).
The most common symptoms exhibited by this cohort were fever (63.1%), cough (71.9%), and dyspnea (52.3%). Twenty-four percent of patients were clinically asymptomatic. Patients who died were older than the discharged ones and the patients who underwent prolonged hospitalization (mean age 70.2 vs 51.9 vs 59.9 years, respectively). There was a higher prevalence of diabetes in the non-survivor group than among discharged patients and those with prolonged hospital stay (33.3% vs 8.2% vs 17.9%, respectively). There were no statistically significant differences in the frequency of hypertension between the non-survivors and the prolonged hospitalization group (53.3% vs 44.6% respectively;
Comparing both the discharged patients and the patients with hospitalization longer than 3 weeks with the non-survivors, the latter exhibited higher median CRP levels (95.5 vs 23 vs 19.1 mg/dL, respectively,
Among 156 patients included in the study, 136 patients (87.2%) had CT evidence of pneumonia. Among the total cohort, 103 patients (66.0%) had ground-glass opacities, 72 (46.2%) had crazy-paving pattern, and 99 (63.5%) had consolidations. These changes had peripheral distribution in 134 (85.9%) cases. In 63 (40.3%) patients, we observed pulmonary infiltrates in both peribronchovascular and peripheral regions. Four patients (2.6%) developed pneumonia only in the peribronchovascular location.
The chi-square test displayed statistically significant differences (
With regard to bronchial changes, there were 76 (48.6%) patients with air bronchogram and 28 (17.9%) patients with bronchiolectasis. In terms of pleural changes, 66 (42.3%) patients exhibited thickening of pleura and 12 had pleural effusion. Other lung changes detected on CT were as follows: 83 (53.2%) patients had fibrotic lesions, 59 (37.8%) had reticular pattern, 43 (27.5%) had subpleural lines, 29 (18.5%) had segmental or subsegmental pulmonary vessel enlargement, 12 (87.7%) had thoracic lymphadenopathy, 7 (4.5%) had air bubble sign, and 6 (3.8%) had halo sign. No centrilobular nodules or reverse halo signs were found.
The chi-square test showed statistically significant differences in the frequency of occurrence of some analyzed lung changes among the studied groups. The non-survivors in comparison to the discharged and the patients who underwent prolonged hospitalization were more likely to have pleural effusion (60.0% vs 4.7% vs 10.7%, respectively;
The Kruskal-Wallis test showed statistically significant differences (s <0.00001) in the TSS score among the analyzed groups of patients (Figure 6). The TSS score in the non-survivor group (M=12.86; Me=15) was significantly higher in comparison to the discharged group (M=4.62; Me=4;
Patients who died had statistically significantly more affected lung lobes (M=4.73; Me=5) than the discharged patients (M=3.05; Me=4;
The analysis showed statistically significant differences (
Discussion
Prediction of disease evolution is important in choosing an appropriate management strategy. Therefore, prediction models based on imaging or combination of imaging and clinical data for detection of people at risk of severe COVID-19 pneumonia need to be developed. First of all, the target population needs to be defined through analysis of clinical datasets. Prognostic outcomes, such as 30-day mortality, should be specified, although there is a group who neither recovered nor died. We included data of those patients in the group “prolong hospital stay”, assuming that the number of patients in this group is significant enough to have a possible impact on the prediction model. Censoring in cases of “lost to follow-up” due to their recovery or home referral causes inappropriate analysis of the gathered data [31].
CT radiomics need to be categorized in order to define patients’ clinical condition based on their radiological status. Validation of severity scales used in the evaluation of chest images is necessary. Intra- and interobserver agreement for the recommended scales should be evaluated to define their clinical value.
Integrating an artificial intelligence tool into the diagnostic process may both reduce time consumption and bias mistake rate. The prognostic value of CT in COVID-19 has not been determined yet, although visual semi-quantitative quantification of disease extent by CT correlated with clinical severity has already been analyzed [23]. The most feasible theoretical model provides diagnostic efficacy along with simplicity in the clinical scenario. The AI system developed by Mei et al achieved an area under the curve of 0.92 with equal sensitivity in comparison to a senior thoracic radiologist. The AI system also improved the detection rate of patients positive for COVID-19 through RT-PCR who had normal results of CT scans, and it correctly identified 17 out of 25 (68%) patients, while the radiologists classified all of those patients as COVID-19-negative [33].
Our study has several limitations. No software-based quantification was calculated; therefore, errors resulting from subjective evaluation of disease severity cannot be excluded. Moreover, the presented results are based solely on COVID-19-positive patients and thus there is a high risk of bias, raising concern that the predictions could be unreliable when applied in daily practice.
Reviewing changes in chest CT findings in consecutive patients hospitalized for COVID-19 at the early stage of the disease and then in the period of 3 weeks provides evidence for the effectiveness of chest CT. Visual assessment of the extent of lung involvement by COVID-19 pneumonia may be useful in routine patient management.
Conclusions
Computed tomographic radiomics exhibit a significant prognostic value in COVID-19 patients. First of all, the TSS score in the non-survivor group is significantly higher as compared to the discharged group and the group of patients hospitalized for longer than 3 weeks. Non-survivors had statistically significantly more affected lung lobes than the discharged patients. Ground-glass opacities do not indicate an increased risk of death although they occur in patients with prolonged hospital stay. Consolidations are the dominant type of pulmonary changes in non-survivors. The signs of pleural effusion, pleural thickening, lymphadenopathy, air bronchogram, and bronchiolectasis are strong predictors of death.
Figures
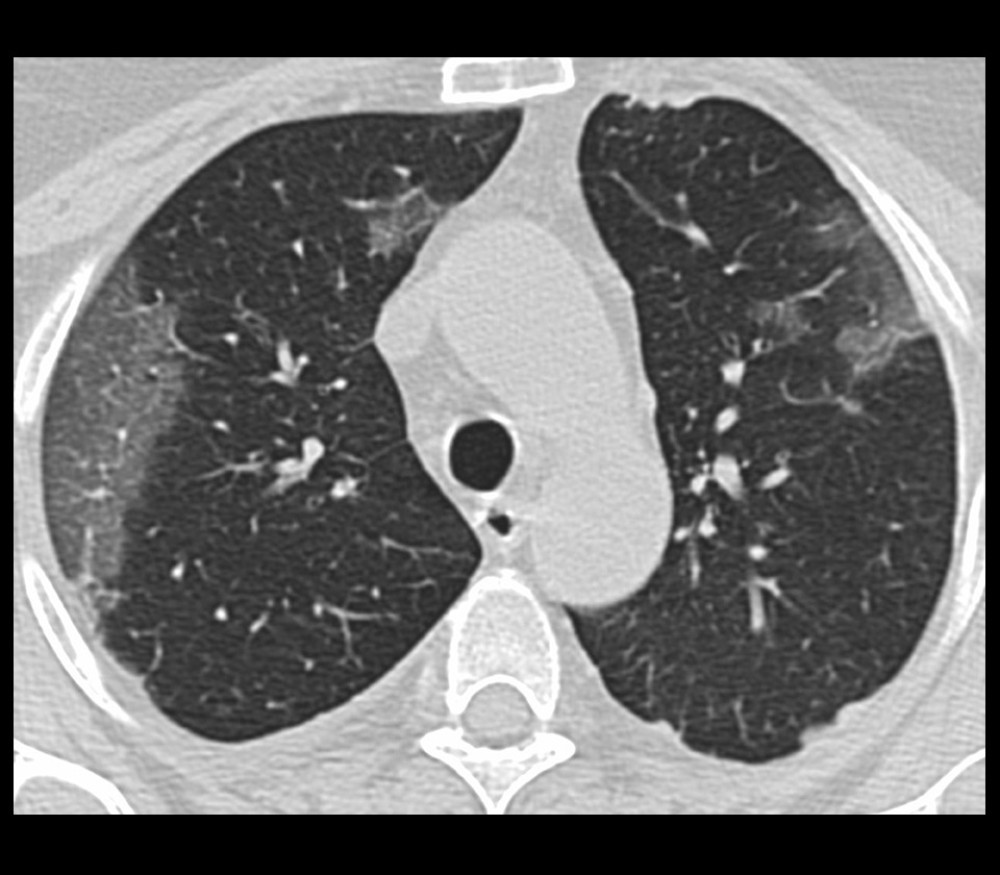 Figure 1. Non-contrast chest CT image of a 20-year-old man with mild COVID-19 pneumonia in the axial plane. CT scan shows ground-glass opacities in multiple lung segments.
 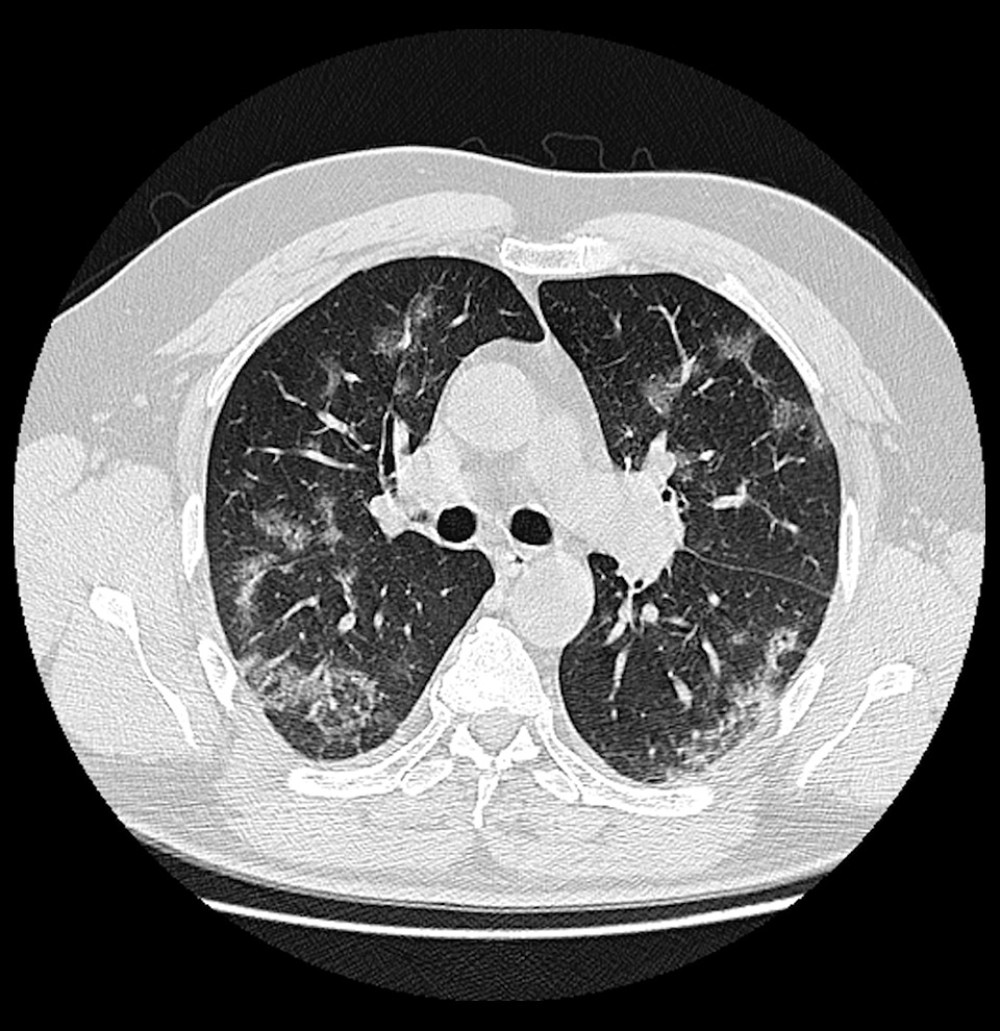 Figure 2. A 66-year-old male COVID-19 patient presenting cough and myalgia for 7 days. CT scan shows a reticular pattern superimposed on the background of GGO, resembling the sign of crazy paving stones.
 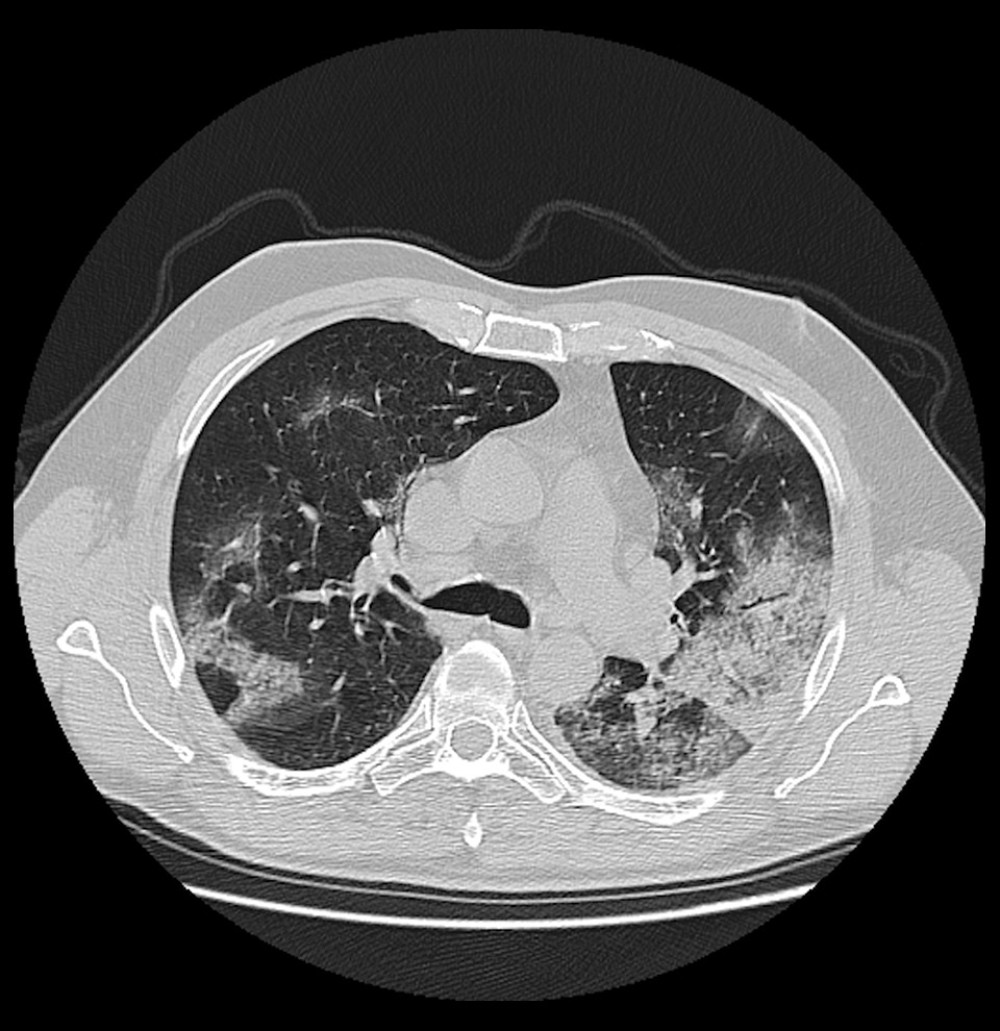 Figure 3. A 82-year-old male COVID-19 patient presenting fever with cough for 11 days. CT scan shows bilateral pulmonary consolidations.
 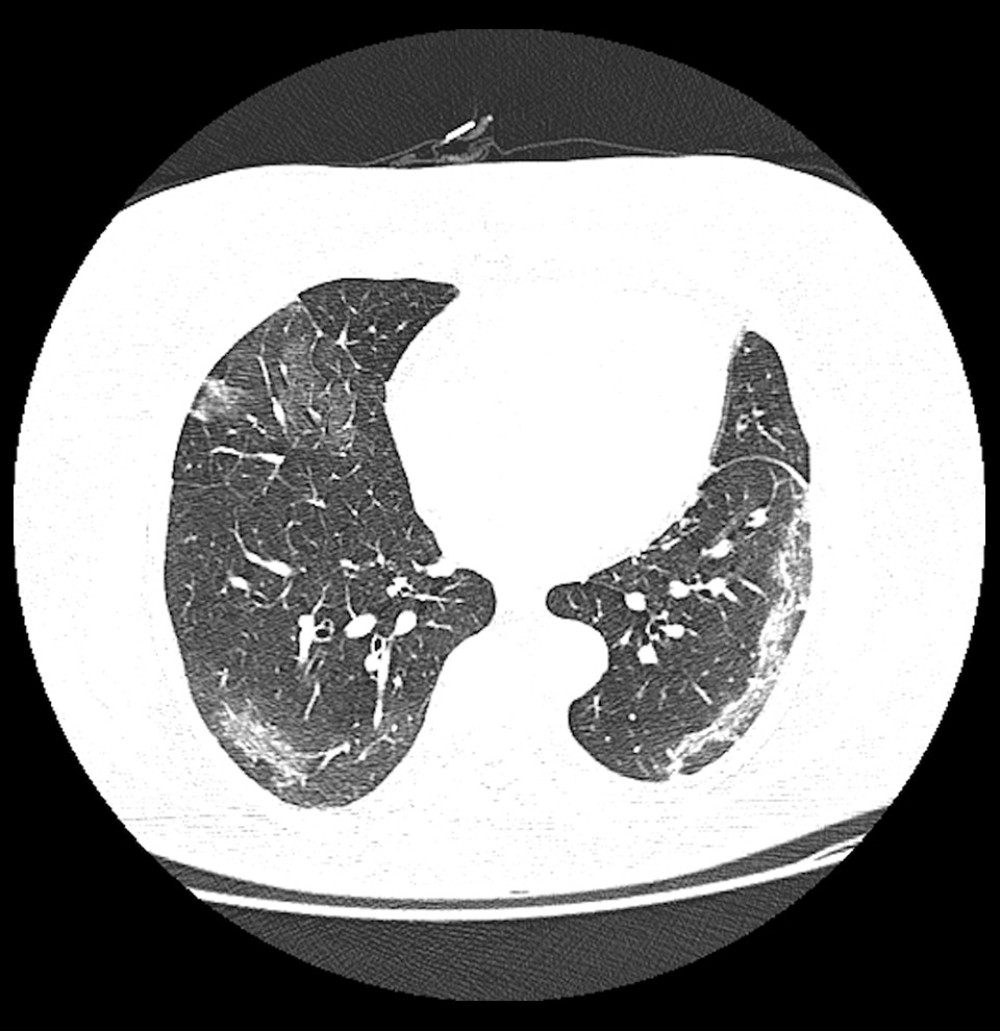 Figure 4. A 49-year-old female COVID-19 patient presenting fever for 8 days. CT scan in the axial plane shows vascular enlargement in the left lung lobe.
 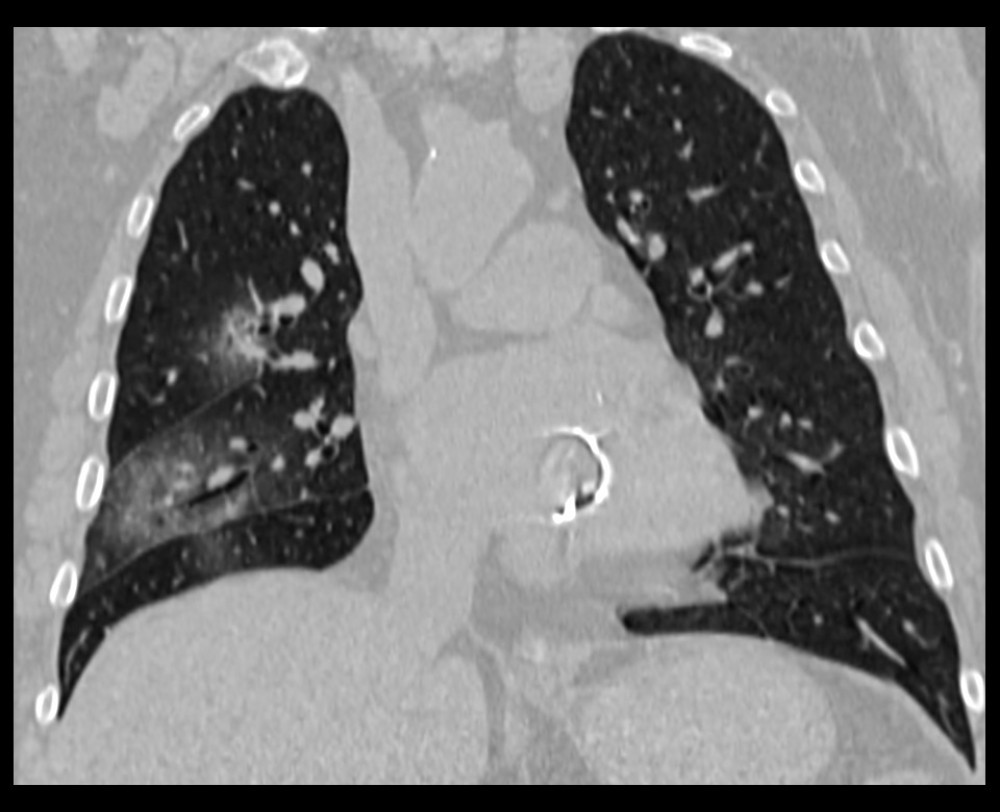 Figure 5. Non-contrast chest CT image of a 27-year-old man with mild COVID-19 pneumonia in the coronal plane. CT scan shows traction bronchiectasis in the right upper and middle lobe.
 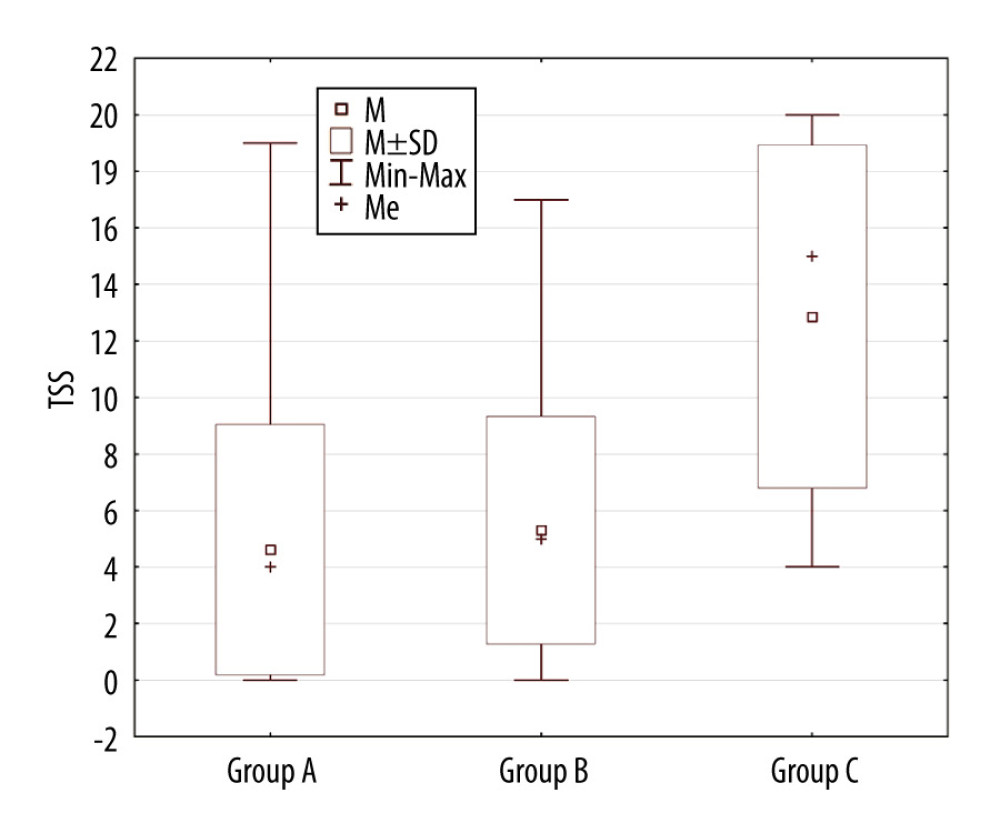 Figure 6. The Kruskal-Wallis test showing statistically significant differences (s <0.00001) in the TSS score between the analyzed groups of patients. Group A – ‘discharged patients’, Group B – ‘patients who underwent prolonged hospitalization’, Group C – ‘non-survivors’.
 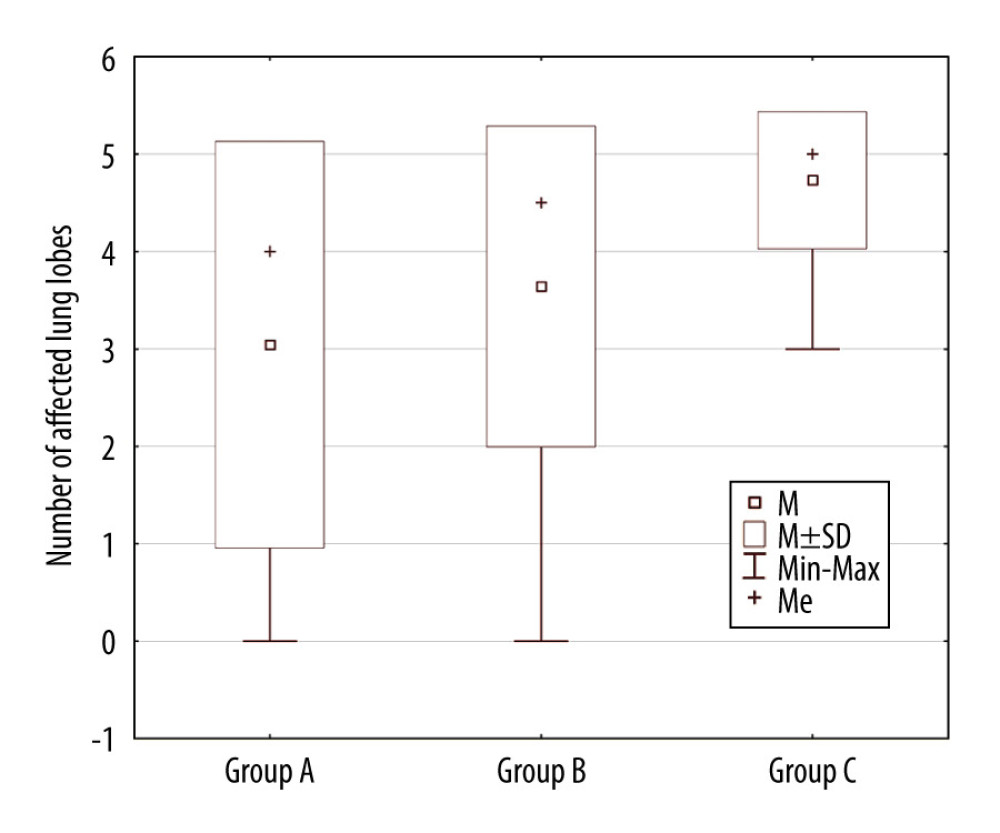 Figure 7. Correlation between the number of affected lung lobes and patient’s outcome. Group A – ‘discharged patients’, Group B – ‘patients who underwent prolonged hospitalization’, Group C – ‘non-survivors’.
 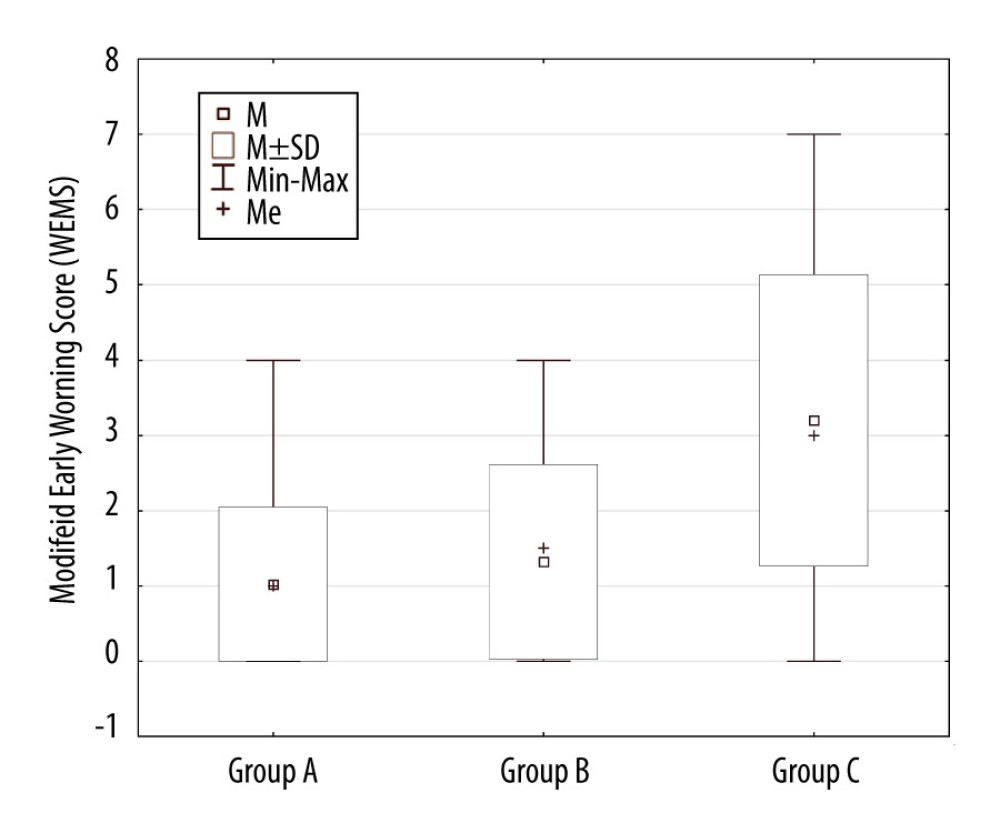 Figure 8. Correlation between MEWS on admission and patient’s outcome. Group A – ‘discharged patients’, Group B – ‘patients who underwent prolonged hospitalization’, Group C – ‘non-survivors’.
 References
1. Lee N, Hui D, Wu A, A major outbreak of severe acute respiratory syndrome in Hong Kong: N Engl J Med, 2003; 348(20); 1986-94
2. Assiri A, Al-Tawfiq JA, Al-Rabeeah AA, Epidemiological, demographic, and clinical characteristics of 47 cases of Middle East respiratory syndrome coronavirus disease from Saudi Arabia: A descriptive study: Lancet Infect Dis, 2013; 13(9); 752-61
3. Guan WJ, Ni ZY, Hu Y, Clinical characteristics of coronavirus disease 2019 in China: N Engl J Med, 2020; 382(18); 1708-20
4. (CDC) USCfDCaP: Symptoms of coronavirus
5. Jędrusik P, Gaciong Z, Sklinda K, Diagnostic role of chest computed tomography in coronavirus disease 2019: Pol Arch Intern Med, 2020; 130(6); 520-528
6. Hu Z, Song C, Xu C, Clinical characteristics of 24 asymptomatic infections with COVID-19 screened among close contacts in Nanjing, China: Sci China Life Sci, 2020; 63(5); 706-11
7. Cao B, Zhang D, Wang C, A trial of lopinavir-ritonavir in COVID-19: Reply N Engl J Med, 2020; 382(21); e68
8. Rodrigues JCL, Hare SS, Edey A, An update on COVID-19 for the radiologist – A British society of Thoracic Imaging statement: Clin Radiol, 2020; 75(5); 323-25
9. Wang D, Hu B, Hu C, Clinical characteristics of 138 hospitalized patients with 2019 novel coronavirus-infected pneumonia in Wuhan, China: JAMA, 2020; 323(11); 1061-69 [Erratum in: JAMA. 2021;325(11): 1113]
10. Zhou F, Yu T, Du R, Clinical course and risk factors for mortality of adult inpatients with COVID-19 in Wuhan, China: A retrospective cohort study: Lancet, 2020; 395(10229); 1054-62
11. Wong HYF, Lam HYS, Fong AH, Frequency and distribution of chest radiographic findings in COVID-19 positive patients: Radiology, 2020; 296(2); E72-78
12. Kanne JP, Little BP, Chung JH, Essentials for radiologists on COVID-19: An Update-Radiology Scientific Expert Panel: Radiology, 2020; 296(2); E113-14
13. American College of Radiology: ACR Recommendations for the use of Chest Radiography and Computed Tomography (CT) for Suspected COVID-19 Infection Accessed online at https://www.acr.org/Advocacy-and-Economics/ACR-Position-Statements/Recommendations-for-Chest-Radiography-and-CT-for-Suspected-COVID19-Infection
14. Peng QY, Wang XT, Zhang LNChinese Critical Care Ultrasound Study Group, Findings of lung ultrasonography of novel corona virus pneumonia during the 2019–2020 epidemic: Intensive Care Med, 2020; 46(5); 849-50
15. Lichtenstein DA, Lung ultrasound in the critically ill: Ann Intensive Care, 2014; 4(1); 1
16. Huang Y, Wang S, Liu Y, A Preliminary study on the ultrasonic manifestations of peripulmonary lesions of non-critical novel coronavirus pneumonia (COVID-19) February 26, 2020 or https://ssrn.com/abstract=3544750
17. Poggiali E, Dacrema A, Bastoni D, Can lung US help critical care clinicians in the early diagnosis of novel coronavirus (COVID-19) pneumonia?: Radiology, 2020; 295(3); E6
18. Ianniello S, Piccolo CL, Buquicchio GL, First-line diagnosis of paediatric pneumonia in emergency: lung ultrasound (LUS) in addition to chest-X-ray (CXR) and its role in follow-up: Br J Radiol, 2016; 89(1061); 20150998
19. Fu F, Lou J, Xi D, Chest computed tomography findings of coronavirus disease 2019 (COVID-19) pneumonia: Eur Radiol, 2020; 30(10); 5489-98
20. Li Y, Xia L, Coronavirus disease 2019 (COVID-19): Role of chest CT in diagnosis and management: Am J Roentgenol, 2020; 214(6); 1280-86
21. Pan F, Ye T, Sun P, Time course of lung changes at chest CT during recovery from coronavirus disease 2019 (COVID-19): Radiology, 2020; 295(3); 715-21
22. Pan Y, Guan H, Zhou S, Initial CT findings and temporal changes in patients with the novel coronavirus pneumonia (2019-nCoV): A study of 63 patients in Wuhan, China: Eur Radiol, 2020; 30(6); 3306-9
23. Yang Q, Liu Q, Xu H, Imaging of coronavirus disease 2019: A Chinese expert consensus statement: Eur J Radiol, 2020; 127; 109008
24. Clinic M: Coronavirus disease 2019 (COVID-19) - symptoms and causes [cited 20202 14 April]
25. Kim JY, Choe PG, Oh Y, The first case of 2019 novel coronavirus pneumonia imported into Korea from Wuhan, China: Implication for Infection Prevention and Control Measures: J Korean Med Sci, 2020; 35(5); e61
26. Inui S, Fujikawa A, Jitsu M, Chest CT findings in cases from the cruise ship diamond princess with coronavirus disease (COVID-19): Radiol Cardiothorac Imaging, 2020; 2(2); e200110 [Erratum in: Radiol Cardiothorac Imaging. 2020;2(2): e204002]
27. Huang P, Liu T, Huang L, Use of chest CT in combination with negative RT-PCR assay for the 2019 novel coronavirus but high clinical suspicion: Radiology, 2020; 295(1); 22-23
28. Xie X, Zhong Z, Zhao W, Chest CT for typical 2019-nCoV pneumonia: Relationship to negative RT-PCR testing: Radiology, 2020; 296(2); E41-45
29. World Health Organisarion, Clinical management of severe acute respiratory infection (SARI) when COVID-19 is suspected: Interim guidance March 13, 2020
30. Wasilewski P, Mruk B, Mazur S, COVID-19 severity scoring systems in radiological imaging – a review: Pol J Radiol, 2020; 85(1); 361-68
31. Li K, Fang Y, Li W, CT image visual quantitative evaluation and clinical classification of coronavirus disease (COVID-19): Eur Radiol, 2020; 30(8); 4407-16
32. Subbe CP, Kruger M, Rutherford P, Gemmel L, Validation of a modified Early Warning Score in medical admissions: QJM, 2001; 94(10); 521-26
33. Mei X, Lee HC, Diao KY, Artificial intelligence-enabled rapid diagnosis of patients with COVID-19: Nat Med, 2020; 26(8); 1224-28
Figures
Figure 1. Non-contrast chest CT image of a 20-year-old man with mild COVID-19 pneumonia in the axial plane. CT scan shows ground-glass opacities in multiple lung segments.Figure 2. A 66-year-old male COVID-19 patient presenting cough and myalgia for 7 days. CT scan shows a reticular pattern superimposed on the background of GGO, resembling the sign of crazy paving stones.Figure 3. A 82-year-old male COVID-19 patient presenting fever with cough for 11 days. CT scan shows bilateral pulmonary consolidations.Figure 4. A 49-year-old female COVID-19 patient presenting fever for 8 days. CT scan in the axial plane shows vascular enlargement in the left lung lobe.Figure 5. Non-contrast chest CT image of a 27-year-old man with mild COVID-19 pneumonia in the coronal plane. CT scan shows traction bronchiectasis in the right upper and middle lobe.Figure 6. The Kruskal-Wallis test showing statistically significant differences (s <0.00001) in the TSS score between the analyzed groups of patients. Group A – ‘discharged patients’, Group B – ‘patients who underwent prolonged hospitalization’, Group C – ‘non-survivors’.Figure 7. Correlation between the number of affected lung lobes and patient’s outcome. Group A – ‘discharged patients’, Group B – ‘patients who underwent prolonged hospitalization’, Group C – ‘non-survivors’.Figure 8. Correlation between MEWS on admission and patient’s outcome. Group A – ‘discharged patients’, Group B – ‘patients who underwent prolonged hospitalization’, Group C – ‘non-survivors’. Tables
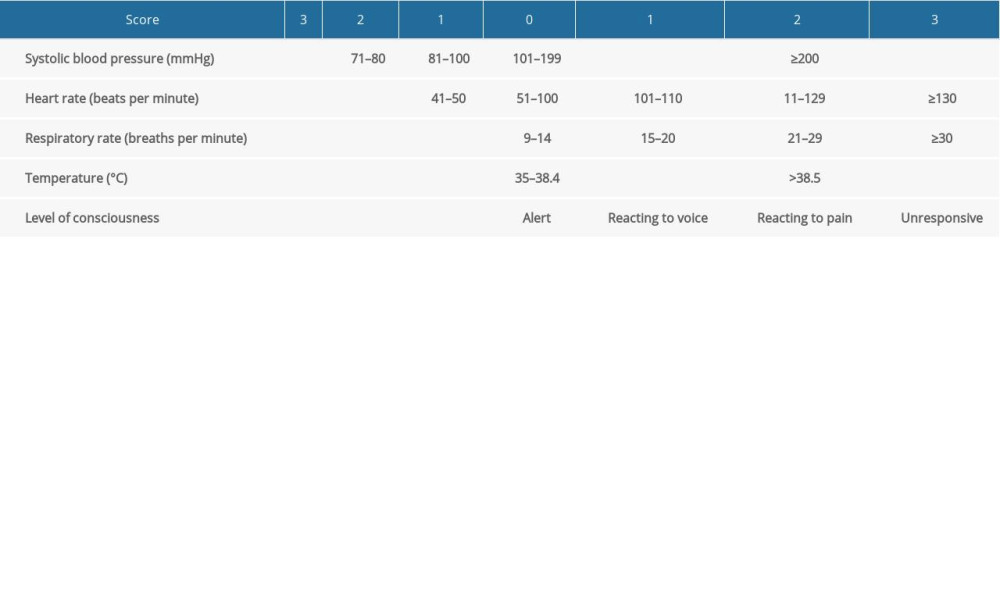 Table 1. Modified Early Warning Score (MEWS) – A scale which includes measurements of systolic blood pressure, heart rate, respiratory rate, body temperature, and level of consciousness.Table 1. Modified Early Warning Score (MEWS) – A scale which includes measurements of systolic blood pressure, heart rate, respiratory rate, body temperature, and level of consciousness.
 In Press
Clinical Research
Institutional and Regional Variations in Access to Clinical Trials and Next-Generation Sequencing in Turkis...Med Sci Monit In Press; DOI: 10.12659/MSM.951027
Clinical Research
Low-Intensity Blood Flow-Restricted Multi-Joint Exercise Improves Muscle Function in Patients With Patellof...Med Sci Monit In Press; DOI: 10.12659/MSM.950516
Review article
Musculoskeletal Ultrasound and MRI in the Evaluation of Chemotherapy-Induced Peripheral Neuropathy: A ReviewMed Sci Monit In Press; DOI: 10.12659/MSM.951283
Clinical Research
Sensory Processing, Dissociation, and Affective Symptoms in Misophonia: A Cross-Sectional Study of 35 AdultsMed Sci Monit In Press; DOI: 10.12659/MSM.950938
Most Viewed Current Articles
17 Jan 2024 : Review article 10,187,196
Vaccination Guidelines for Pregnant Women: Addressing COVID-19 and the Omicron VariantDOI :10.12659/MSM.942799
Med Sci Monit 2024; 30:e942799
13 Nov 2021 : Clinical Research 3,708,487
Acceptance of COVID-19 Vaccination and Its Associated Factors Among Cancer Patients Attending the Oncology ...DOI :10.12659/MSM.932788
Med Sci Monit 2021; 27:e932788
14 Dec 2022 : Clinical Research 2,341,643
Prevalence and Variability of Allergen-Specific Immunoglobulin E in Patients with Elevated Tryptase LevelsDOI :10.12659/MSM.937990
Med Sci Monit 2022; 28:e937990
16 May 2023 : Clinical Research 706,524
Electrophysiological Testing for an Auditory Processing Disorder and Reading Performance in 54 School Stude...DOI :10.12659/MSM.940387
Med Sci Monit 2023; 29:e940387