04 December 2020: Database Analysis
Construction and Validation of a 7-Immune Gene Model for Prognostic Assessment of Esophageal Carcinoma
Haitao Chen1ABCEF, Jun Luo23BCD, Jianchun Guo23ADEF*DOI: 10.12659/MSM.927392
Med Sci Monit 2020; 26:e927392


Abstract
BACKGROUND: We constructed a predictive risk model of esophageal carcinoma (EC) for prognostic prediction.
MATERIAL AND METHODS: Immune genes and the expression data were downloaded from the ImmPort database and The Cancer Genome Atlas database. Univariate analysis, Lasso regression, and multivariate analysis were applied to screen the ultimately included prognostic immune genes for the model based on the training cohort. Survival analysis and receiver operating characteristic (ROC) curve were applied to evaluate the model. The model was further validated in the testing and entire cohorts, and the clinical utility of the model and its ability to assess the subtypes of EC were evaluated in the entire cohort.
RESULTS: We detected 297 differentially expressed immune genes, including 241 upregulated genes and 56 downregulated genes in EC patients. Based on these genes, we developed a 7-immune gene model of EC, including HSPA6, S100A12, NOS2, DKK1, OSM, AR, and OXTR. The area under the curve (AUC) of the model at 1 year was 0.825. Similarly, the AUC values for the validating cohorts were 0.813 and 0.816, respectively. Pathological stage and risk score of the model were independent prognostic factors. This model was effective for both subtypes of EC.
CONCLUSIONS: We constructed a 7-gene model consisting of HSPA6, S100A12, NOS2, DKK1, OSM, AR, and OXTR. This risk model could be used for prognostic prediction of EC.
Keywords: Biological Markers, Esophageal Neoplasms, Cohort Studies, Databases as Topic, Gene Expression Profiling, gene ontology, Gene Regulatory Networks, Models, Biological, ROC Curve, Reproducibility of Results, Risk Factors, Transcription Factors
Background
Esophageal carcinoma (EC) is one of the most common types of cancer worldwide [1,2]. The incidence and mortality rates of EC are high, with 0.59 new cases and 0.548 deaths per 1000 people worldwide in 2017 [3]. Male sex and age over 70 years were risk factors of EC [3,4]. However, patients are usually diagnosed at the terminal stage, when it is often too late for optimal treatment [3–5]. In addition, patients with a similar pathological stage may still have different overall survival (OS) as a result of individual differences [6]. Therefore, it is urgent to find molecular biomarkers for early diagnosis and accurate prognosis prediction of EC.
Despite the advances made in multiple therapies, the prognosis of EC patients remains poor [7]. Immunotherapy is an innovative treatment strategy that has shown encouraging efficacy in several types of cancer, including EC [8]. Recently, checkpoint inhibitors have achieved encouraging success in treating lung cancers and melanoma [9,10], which increases optimism about immunotherapy as a rational strategy for EC treatment. EC has very high rates of somatic mutations [11], which may be exploitable, promoting recognition by the immune system and subsequent tumor elimination. The immunotherapeutic approach may be superior to conventional anticancer agents due to the targeted therapy. However, immunotherapy has clinical and economic limitations, and response rates are limited to a small patient population [12,13]. Currently, biomarkers that predict response to immune therapy for clinical application are still in the early stages of development [14]. Thus, it is essential to identify gene models to reflect the immune status and to assess the prognosis of EC.
In the present study, we developed a molecular model according to the differentially expressed (DE) immune genes, which can contribute to the early diagnosis and prognostic evaluation of EC patients. In addition, our study identified many DE immune genes and detected the enriched functions, pathways, and transcription factors (TFs), which could lay a foundation for further basic research and provide useful information for molecularly-targeted therapy and immunotherapy in EC patients.
Material and Methods
DATABASE PROCESSING:
Transcriptomic data and clinical information, including survival outcome, age, sex, the histologic grade, as well as pathological stage, were obtained from The Cancer Genome Atlas (TCGA) database. In addition, the list of immune genes was obtained from the ImmPort database (
IDENTIFICATION OF DE IMMUNE GENES:
The Wilcox test was applied for differential analysis. False discovery rate (FDR) <0.05 and log2 (fold change [FC]) >1 were set as the cut-offs for DE genes. Then, the DE immune genes were detected based on immune genes and the identified DE genes. The Pheatmap package and gplots package with R software (v3.6.1) was applied to construct the heatmaps and volcano maps of the DE genes and the DE immune genes.
FUNCTION AND PATHWAY ENRICHMENT ANALYSIS:
We used the clusterProfiler package and the org.Hs.eg.db package to perform gene ontology (GO) analysis and the Kyoto Encyclopedia of Genes and Genomes (KEGG) was used for the analysis of the DE immune genes. GO terms included cellular component, biological process, and molecular function. P.adjust <0.05 was set as the cut-off for significantly enriched GO and KEGG terms.
DEVELOPMENT OF A DE IMMUNE GENES-TFS NETWORK:
The Database for Annotation, Visualization, and Integrated Discovery (DAVID) (v6.8) was used to detect the enriched TFs of the DE immune genes. Bonferroni <0.05 and Benjamini <0.05 were the cut-off criteria used to identify significantly enriched TFs. The interactions between the identified immune genes and the significantly enriched TFs were imported into Cytoscape (v3.7.2) to construct a DE immune genes-TFs network.
IDENTIFICATION OF A RISK MODEL:
To build the prognostic model, univariate Cox regression analysis, LASSO regression, and multivariate Cox regression analysis were applied using R software (v3.6.1) based on the methodology of previously published studies [15–17]. Firstly, univariate analysis was performed to screen the significant DE immune genes based on the detected immune genes using the “survival” package. The genes with P<0.05 were defined as being related to OS. Then, Lasso regression with the “glmnet” package was applied to remove functionally similar genes to avoid model overfitting. Finally, based on the results of Lasso regression, multivariate analysis was performed with the “survival” package to determine the ultimately included genes of the model. The differential expression of these genes between normal and cancer samples in the TCGA was shown in the boxplot. The Oncomine database (https://www.oncomine.org) was used to validate the expression of these genes. The risk score was determined according to the following formula:
N, Exp, and Coe represented the number of signature genes, the expression level of immune genes, and the coefficient value, respectively. On the basis of the median of the risk score, patients were separated into 2 subgroups. A low-risk score represents good survival for EC patients. We utilized Kaplan-Meier analysis to compare the survival rate of the 2 groups. We used the log-rank test to assess the survival difference between the low-risk and high-risk groups. The receiver operating characteristic (ROC) curve and the area under the ROC (AUC) value was applied to evaluate the risk model. We used risk score plots and heatmap of gene expression to assess the model.
VALIDATION OF THE RISK MODEL:
To verify the universality of the immune gene model, the testing group and the entire group were also analyzed. The survival analysis and the ROC curve were also used to assess the model. Similarly, risk score plots and gene expression heatmap using R software (v3.6.1) were applied for evaluation of the model.
CLINICAL UTILITY OF THE MODEL:
We applied univariate and multivariate Cox analyses to evaluate our model and other prognostic variables, involving age, sex (0 for female and 1 for male), grade, and pathological stage. Independent prognostic variables were identified by Cox analyses.
APPLICATION OF THE MODEL IN BOTH SUBTYPES OF EC:
The expression of the identified DE immune genes in the model was detected in both subtypes of EC. Survival analysis was conducted to assess the model in both subtypes of EC.
Results
DATABASE PROCESSING:
Gene expression data of 171 samples (160 EC and 11 normal) were obtained from TCGA database. One sample without follow-up data was excluded. The basic information of the remaining 159 samples is presented in Table 1. Further, these tumor samples were randomly divided into a training group and a testing group (Table 2). The former was applied for the construction of the model. The latter and the entire group were used for validation. The workflow is depicted in Figure 1.
IDENTIFICATION OF DE IMMUNE GENES:
In total, 2835 DE genes (2231 upregulated and 604 downregulated) were detected in EC samples. Subsequently, 297 DE immune genes, including 241 upregulated genes and 56 downregulated genes, were identified. These genes are depicted in a volcano map and heatmap (Figure 2A–2D). The top 10 downregulated and upregulated DE immune genes are presented in Table 3.
GO AND KEGG ANALYSIS:
1754 significantly enriched GO terms (43 molecular function terms, 1652 biological process terms, and 59 cellular component terms) were detected. Similarly, 75 significant KEGG terms were discovered. The first 9 GO terms and the first 10 KEGG terms were shown in Figure 3A and 3B, respectively.
DEVELOPMENT OF A DE IMMUNE GENES-TFS NETWORK:
Two DE TFs were identified based on the DAVID database. Then, the qualified 119 DE immune genes-DE TFs interactions were imported into Cytoscape (v3.7.2) to construct a network, including 58 DE upregulated immune genes, 15 DE downregulated immune genes, and 2 DE TFs (Figure 3C).
IDENTIFICATION OF A RISK MODEL:
We applied univariate Cox analysis to screen 11 significant immune genes (Figure 4A). Further, we identified 10 candidate genes using Lasso regression (Figure 4B, 4C). At last, 7 immune genes were obtained, including heat shock proteins A6 (HSPA6), S100A12, NOS2, Dickkopf-1 (DKK1), Oncostatin M (OSM), androgen receptors (AR), and oxytocin receptor (OXTR) (Figure 4D). Only one of these genes is a low-hazard gene (Figure 4E). The expression of these genes was also validated using the Oncomine database (Figure 5A–5G). To predict the prognosis of EC in the training group, the risk score model was created with the following formula: the risk score=(0.0095×gene expression level of HSPA6)+ (0.0034×gene expression level of S100A12)+ (0.016×gene expression level of NOS2)+ (0.0129×gene expression level of DKK1)+ (0.2706×gene expression level of OSM)+ (−1.6913×gene expression level of AR)+ (0.1402×gene expression level of OXTR).
All EC patients were classified into a high-risk group (n=39) and a low-risk group (n=40) according to the median risk score in the training cohort. The ROC curve showed a significant difference between the high-risk and the low-risk groups (P=1.224e-03) (Figure 6A). Additionally, the AUC values of the risk model at 1 and 3 years were 0.825 and 0.677, respectively (Figure 6B). The risk curve and the heatmap are depicted in Figure 6C–6E.
VALIDATION OF THE RISK MODEL:
Patients in the validating groups were classified into 2 groups. Firstly, the survival curves differed significantly between the high-risk and low-risk subgroups in both validating groups (all P<0.05) (Figure 7A, 7C). Meanwhile, the AUC values of the model at 1 and 3 years were 0.813 and 0.596 in the testing group (Figure 7B). Similarly, the AUC values were 0.816 and 0.65 in the entire group (Figure 7D). The risk curve and the heatmap of the immune gene expression in the validating groups are illustrated in Figure 8A–8F.
CLINICAL UTILITY OF THE MODEL:
We found that pathological stage and risk score of the model were associated with OS in the entire group (all P<0.05) (Figure 9A, 9B). This means that these 2 factors were independent variables for the prognostic assessment of EC. These 2 variables were compared, showing that the risk score of the model was more accurate in predicting 1-year OS compared with the pathological stage (Figure 9C).
APPLICATION OF THE MODEL IN BOTH SUBTYPES OF EC:
The expression of the identified DE immune genes of the model in both subtypes was shown in Figure 10A and 10B, and the survival analysis of the model in both subtypes was shown in Figure 10C and 10D.
Discussion
The prognosis of EC patients is poor due to the high rates of recurrence and death after surgery [18]. In addition, there have been few effective and reliable biomarkers available for accurate prognosis prediction of EC. Thus, it is urgent to develop a robust prediction model to forecast EC outcomes.
In the present study, an immune gene model containing 7 DE immune genes was developed, including HSPA6, S100A12, NOS2, DKK1, OSM, AR, and OXTR. First, we constructed this model with the detected DE immune genes. All these DE genes between EC and normal tissues appear to play crucial roles in the early diagnosis of EC. Furthermore, several methods were used in model selection, and the model was verified by the validating groups. This means that the model is accurate and reliable. Furthermore, these identified immune genes are potential molecular targets in immunotherapy. S100A12, a member of the S100 gene family, was reported to be closely associated with EC [19]. DKK1, which is a secreted glycoprotein, was demonstrated to promote tumor growth and may be a new therapeutic target in EC [20]. AR was suggested to play a crucial role in the genesis of EC [21]. Lagergren et al. [22] found that OXTR was associated with an increased risk of EC. Upregulation of HSPA6 was associated with poor outcomes in hepatocellular carcinoma [23]. NOS2 was identified as a prognostic factor for the malignancy and recurrence of glioblastoma [24]. OSM, as an inflammatory cytokine, was found to be upregulated in breast cancer, and early therapeutic inhibition of OSM could prevent breast cancer metastasis [25]. The roles of HSPA6, NOS2, and OSM in the progression of EC need further research.
EC was reported to be sex-linked, with a male predominance [21], which is consistent with the present study, in which sex was a prognostic factor for EC. Our multivariate Cox analysis demonstrated that the pathological stage and the risk score were independent prognostic variables. Further, the comparison revealed that the risk model was not inferior to pathological stage in predicting the prognosis of EC. Thus, the model in the present study could be used clinically for the prognosis assessment of EC.
In this study, significantly enriched function terms included cytokine activity, leukocyte migration, cell chemotaxis, and receptor ligand activity. Cytokines are soluble proteins that mediate intercellular communication. An increasing number of clinical trials are exploring the efficacy and safety of cytokine-based drugs combined with other immunomodulatory medications in view of its anti-tumor properties [26–28]. Factors beyond tumor cells, including immune cells and extracellular matrix components, are also essential to esophageal tumorigenesis [29]. It was reported that leukocytes can interact with cancer cells at the site of solid tumors and in the bloodstream [30]. Migration of leukocytes, as an immune response, might reflect the status of the tumor microenvironment [31]. Enriched KEGG terms comprised IL-17 signaling pathway, cytokine-cytokine receptor interaction, and chemokine signaling pathway. IL-17A, a pro-inflammatory cytokine, was proved to promote the invasiveness and migration of EC cells and could be a potential therapeutic target for EC [32]. In addition, chemokines, including IL8, CXCL1, and CXCL3, were overexpressed during esophageal carcinogenesis, and the chemokine signaling pathway plays important roles in the development of EC [33]. Enrichment analysis of TFs identified STAT and NF-κB. A previous study reported increased expression of STAT3 in EC patients and might be involved in esophageal tumorigenesis [34]. NF-κB overexpression was also found to be related to the poor prognosis of EC [35]. All the enriched functions, pathways, and TFs reveal the crucial role of immunity in tumors and may provide potential targets for immunotherapy of EC.
Considering the differences between these 2 subtypes in terms of etiology, epidemiology, molecular features, and responses to current therapeutic regimens, we assessed the application of the model in both subtypes of EC. The results of the differential expression of the immune genes in the 2 subtypes were consistent with the overall results. In addition, the model could be applied to the 2 subtypes of EC, although there was no significant difference between the high-risk group and the low-risk group in squamous cell carcinoma of EC (
Several limitations of the current study should be addressed. Firstly, the AUC values of the model at 3-year follow-up were inferior to those at 1 year, possibly due to the limited number of patients with more than 3 years of follow-up. Secondly, this study was based on public databases, so the results need to be confirmed by clinical trials. Thirdly, the biological functions of these 7 immune-related genes and their role in the progression of EC need further evaluation in basic experiments.
Conclusions
We identified a 7-gene model consisting of HSPA6, S100A12, NOS2, DKK1, OSM, AR, and OXTR. This risk model was validated and can be used for prognosis evaluation in EC.
Figures
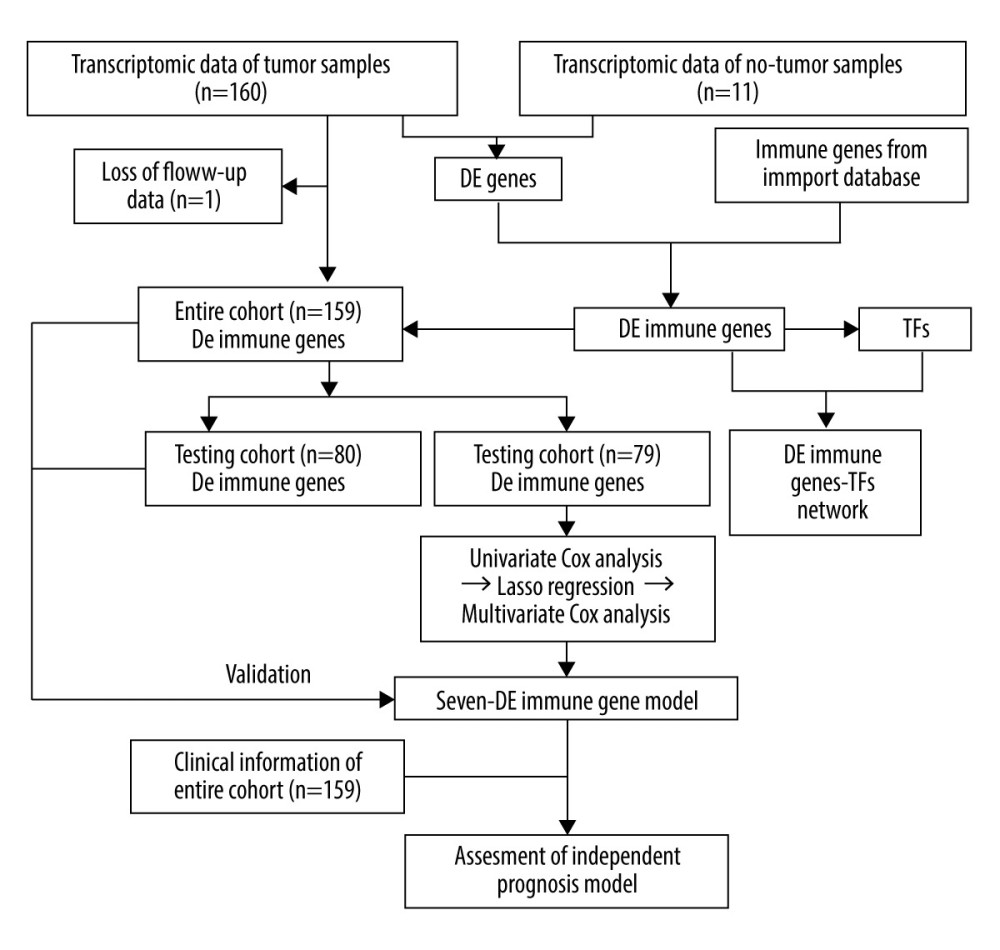 Figure 1. The workflow of this study. DE – differentially expressed; GO – gene ontology; KEGG – Kyoto Encyclopedia of Genes and Genomes; TFs – transcription factors.
 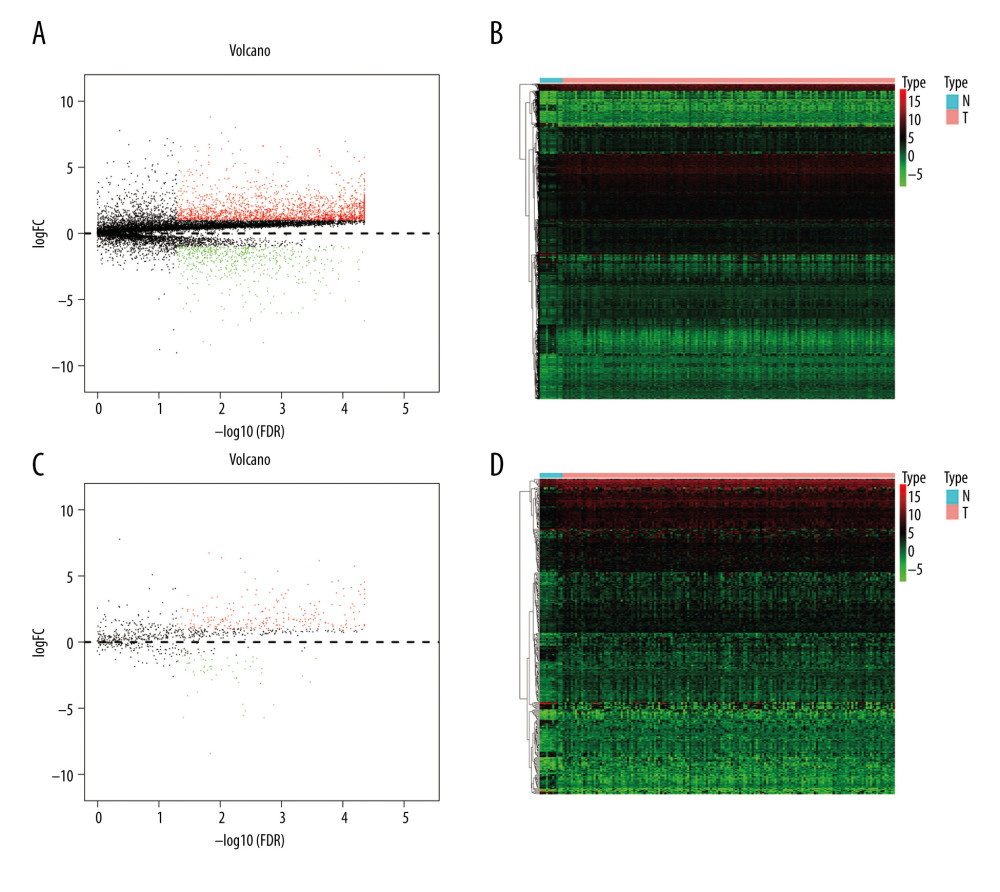 Figure 2. Identification of the differentially expressed (DE) immune genes. (A, B) Volcano plot and the heatmap of the DE genes. (C, D) Volcano plot and the heatmap of the DE immune genes.
 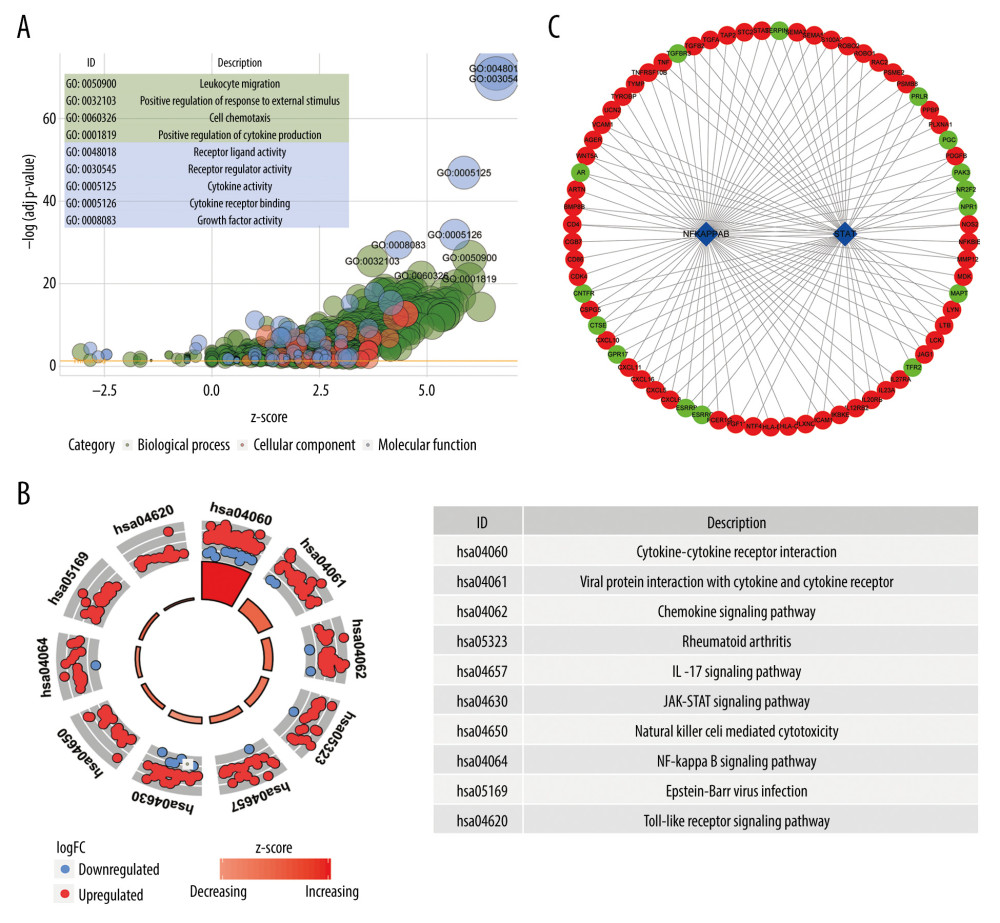 Figure 3. Functions and transcription factors (TFs) enrichment analysis of the differentially expressed (DE) immune genes. (A) Gene ontology (GO) terms. (B) Kyoto Encyclopedia of Genes and Genomes (KEGG) terms. (C) A DE immune genes-TFs network.
 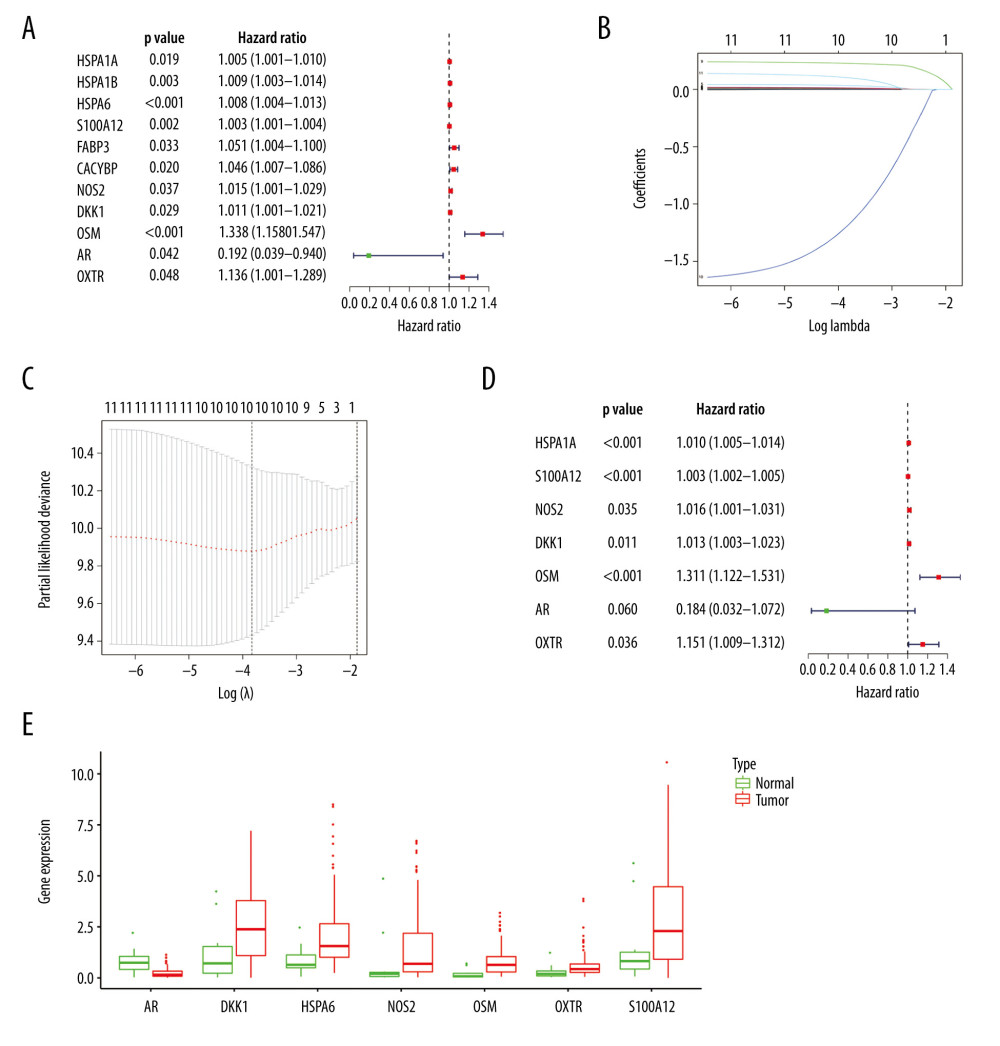 Figure 4. Construction of the model based on the training group. (A) Univariate Cox analysis. (B, C) Lasso regression. (D) Multivariate Cox analysis. (E) The expression of 7 DE immune genes in esophageal carcinoma patients.
 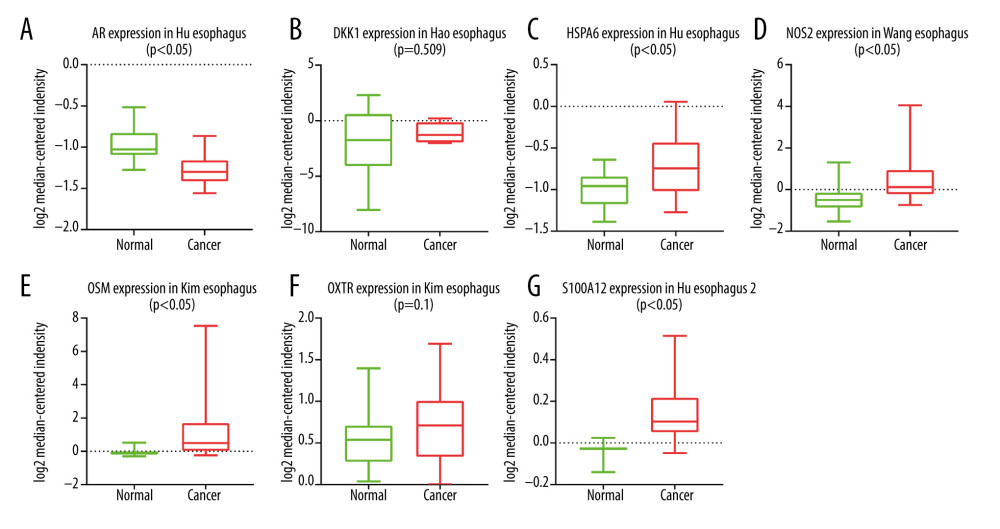 Figure 5. (A–G) The expression of 7 DE immune genes between normal and esophageal carcinoma samples in the Oncomine database.
 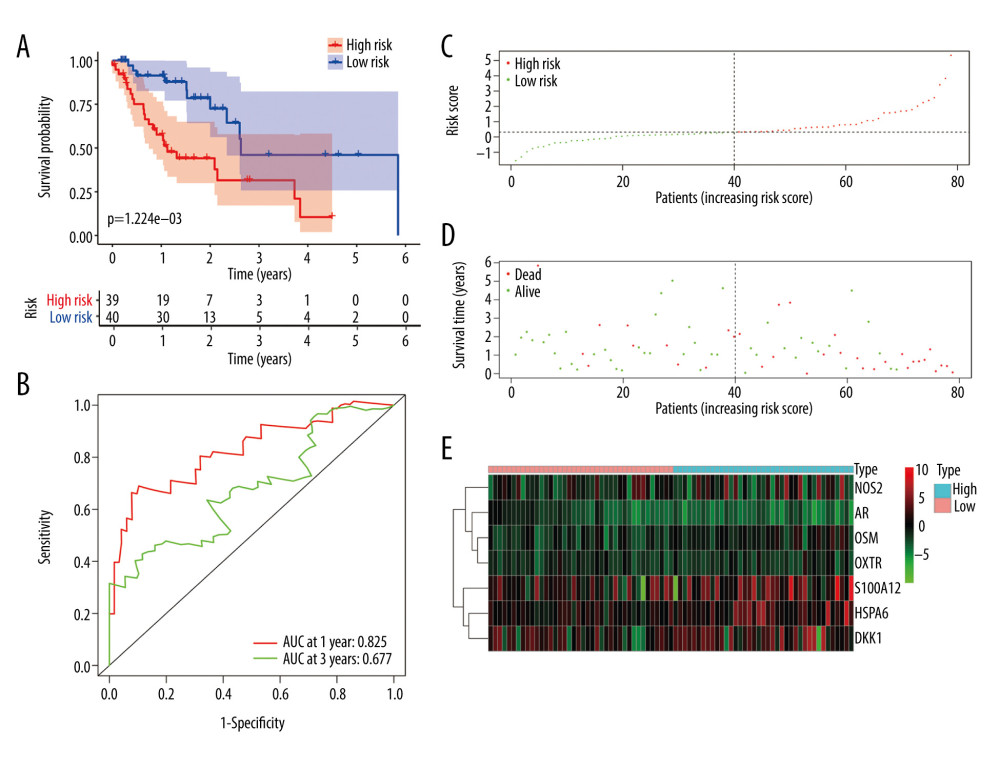 Figure 6. Evaluation of the prognostic signature in the training group. (A) Overall survival (OS) in the training cohort. (B) Time-dependent receiver operating characteristic (ROC) curve analysis in the training cohort. (C) The risk score distribution plot in the training cohort. (D) Survival status plot in the training cohort. (E) Heatmap of risk genes in the training cohort.
 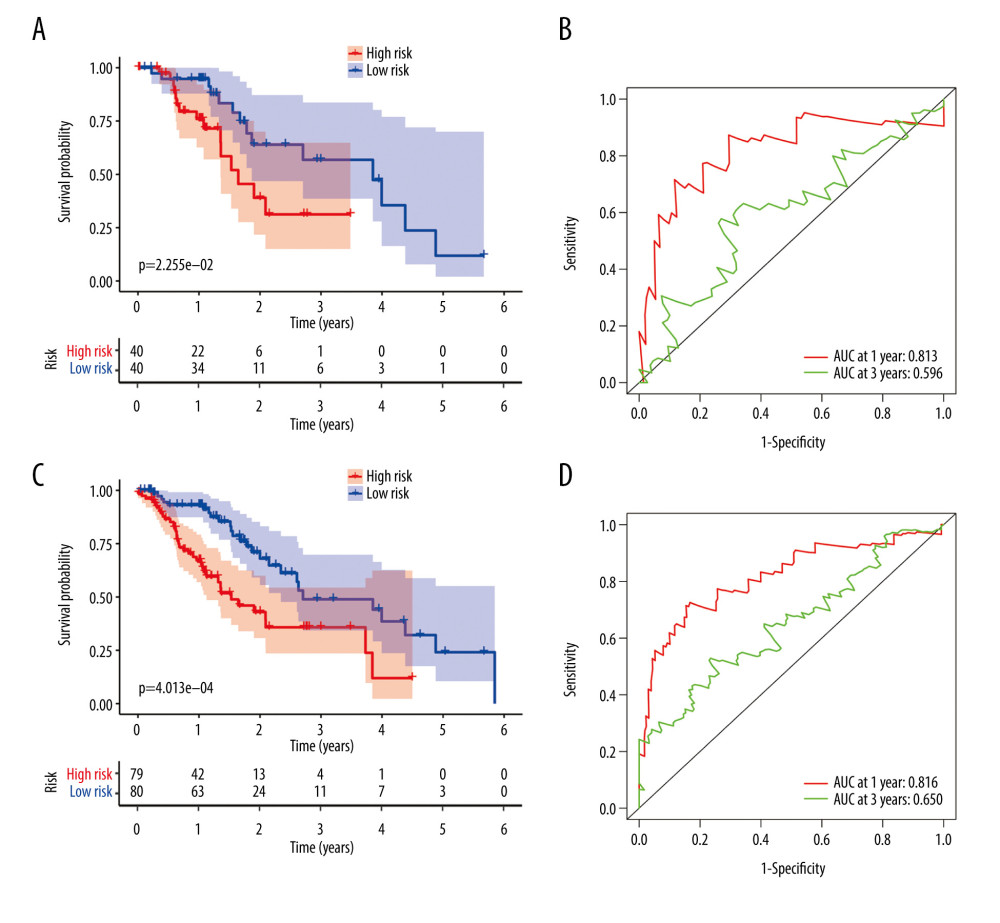 Figure 7. Validation of the prognostic model in the testing and entire cohort. (A) Overall survival (OS) in the testing group. (B) The receiver operating characteristic (ROC) curve in the testing group. (C) OS in the entire group. (D) The ROC curve in the entire group.
 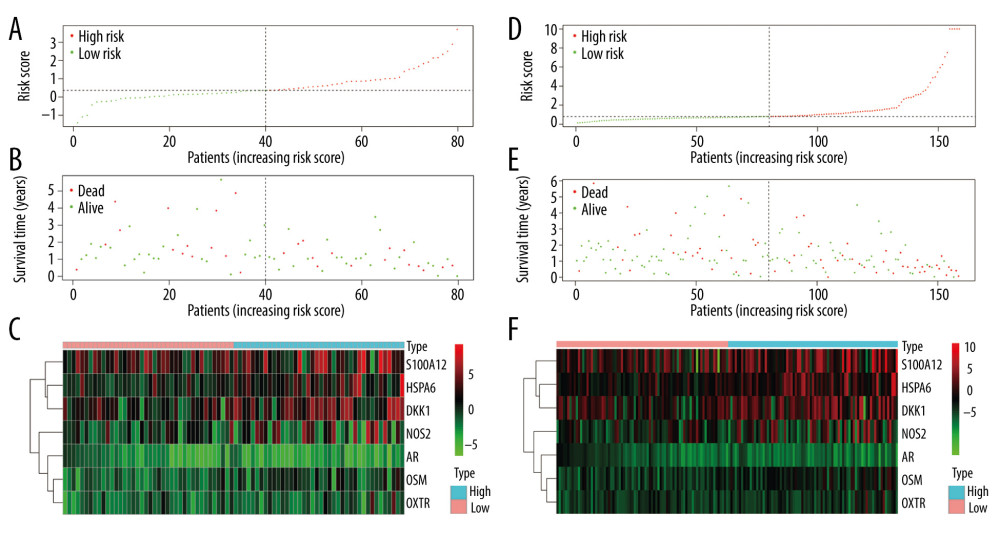 Figure 8. Evaluation of the prognostic signature in the validating cohorts. (A) The risk score distribution plot in the testing cohort. (B) Survival status plots in the testing cohort. (C) Heatmap of risk genes in the testing cohort. (D) The risk score distribution plot in the entire cohort. (E) Survival status plots in the entire cohort. (F) Heatmap of risk genes in the entire cohort.
 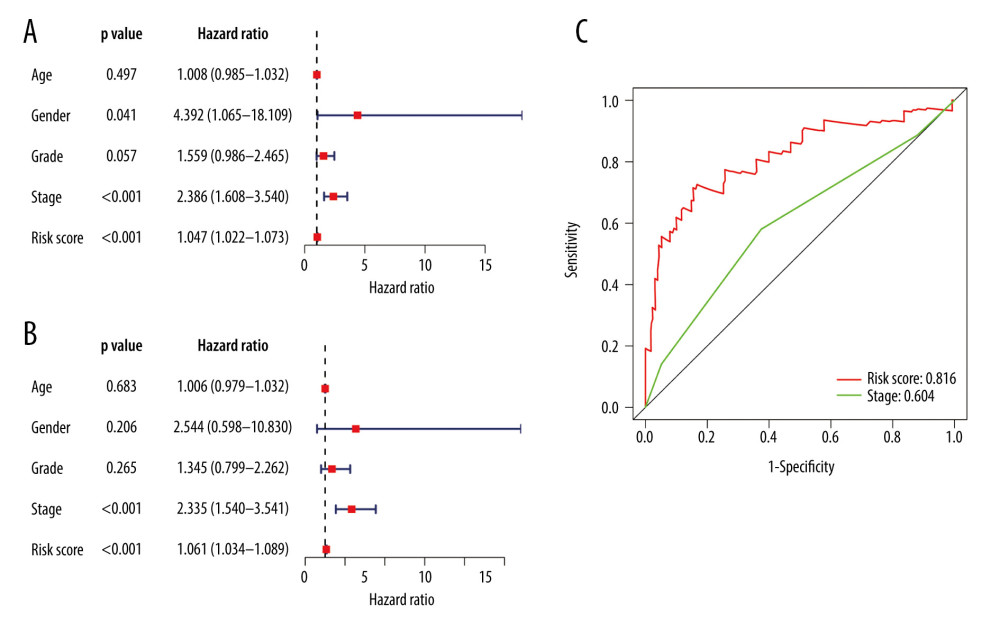 Figure 9. Clinical utility of the model in the entire cohort. (A) Univariate Cox analysis. (B) Multivariate Cox analysis. (C) The receiver operating characteristic (ROC) curve of the prognostic variables in the entire group at 1 year.
 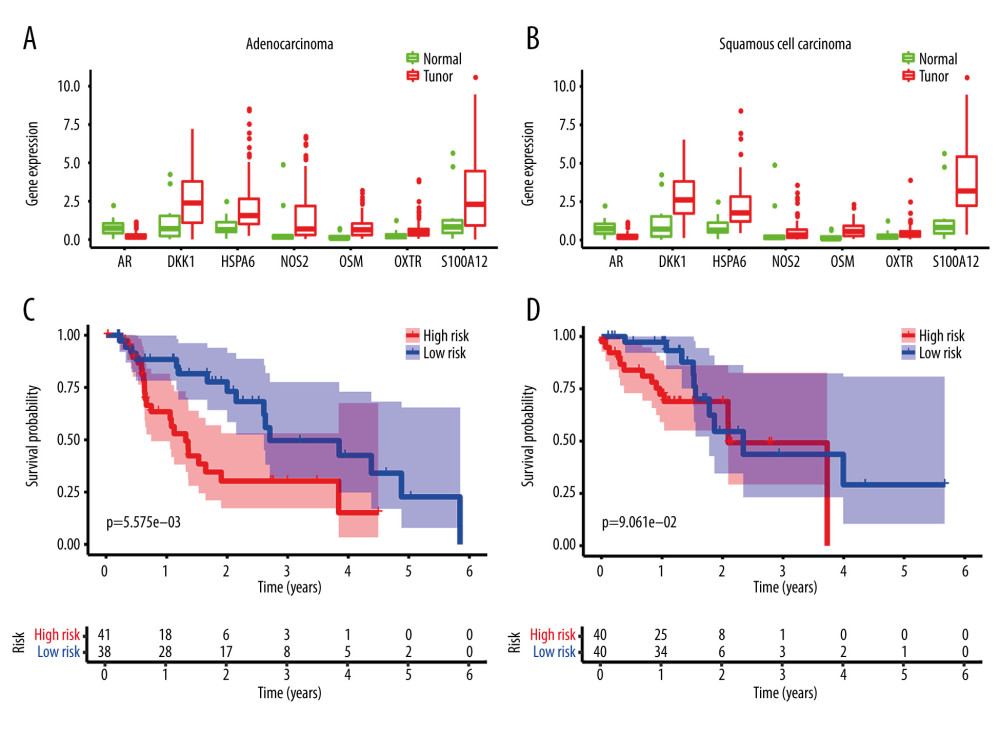 Figure 10. Application of the model in both subtypes of esophageal carcinoma (EC). (A) The expression of the DE immune genes in adenocarcinoma of EC. (B) The expression of the DE immune genes in squamous cell carcinoma of EC. (C) Survival analysis of the risk model in adenocarcinoma of EC. (D) Survival analysis of the risk model in squamous cell carcinoma of EC.
 References
1. Torre LA, Bray F, Siegel RL, Global cancer statistics, 2012: Cancer J Clin, 2015; 65(2); 87-108
2. Yamamoto S, Kato K, Immuno-oncology for esophageal cancer: Future Oncol, 2020 [Online ahead of print]
3. Fan J, Liu Z, Mao X, Global trends in the incidence and mortality of esophageal cancer from 1990 to 2017: Cancer Med, 2020 [Online ahead of print]
4. Malhotra GK, Yanala U, Ravipati A, Global trends in esophageal cancer: J Surg Oncol, 2017; 115(5); 564-79
5. Sudo K, Kato K, Matsuzaki J, Development and validation of an esophageal squamous cell carcinoma detection model by large-scale microRNA profiling: JAMA Netw Open, 2019; 2(5); e194573
6. Zhu R, Yang X, Guo W, An eight-mRNA signature predicts the prognosis of patients with bladder urothelial carcinoma: Peer J, 2019; 7; e7836
7. Sharma P, Allison JP, The future of immune checkpoint therapy: Science, 2015; 348(6230); 56-61
8. Alsina M, Moehler M, Lorenzen S, Immunotherapy of esophageal cancer: Current status, many trials and innovative strategies: Oncol Res Treat, 2018; 41(5); 266-71
9. Garon EB, Rizvi NA, Hui R, Pembrolizumab for the treatment of non-small-cell lung cancer: N Engl J Med, 2015; 372(21); 2018-28
10. Feld E, Mitchell TC, Immunotherapy in melanoma: Immunotherapy, 2018; 10(11); 987-98
11. Lawrence MS, Stojanov P, Polak P, Mutational heterogeneity in cancer and the search for new cancer-associated genes: Nature, 2013; 499(7457); 214-18
12. Meng X, Huang Z, Teng F, Predictive biomarkers in PD-1/PD-L1 checkpoint blockade immunotherapy: Cancer Treat Rev, 2015; 41(10); 868-76
13. van Rossum PSN, Mohammad NH, Vleggaar FP, van Hillegersberg R, Treatment for unresectable or metastatic oesophageal cancer: Current evidence and trends: Nat Rev Gastroenterol Hepatol, 2018; 15(4); 235-49
14. Park R, Williamson S, Kasi A, Saeed A, Immune therapeutics in the treatment of advanced gastric and esophageal cancer: Anticancer Res, 2018; 38(10); 5569-80
15. Wen F, Huang J, Lu X, Identification and prognostic value of metabolism-related genes in gastric cancer: Aging (Albany NY), 2020; 12(17); 17647-61
16. Jiang H, Xu S, Chen C, A ten-gene signature-based risk assessment model predicts the prognosis of lung adenocarcinoma: BMC Cancer, 2020; 20(1); 782
17. Zhao J, Chang L, Gu X, Systematic profiling of alternative splicing signature reveals prognostic predictor for prostate cancer: Cancer Sci, 2020; 111(8); 3020-31
18. Lee EJ, Lee BB, Han J, CpG island hypermethylation of E-cadherin (CDH1) and integrin alpha4 is associated with recurrence of early stage esophageal squamous cell carcinoma: Int J Cancer, 2008; 123(9); 2073-79
19. Ji J, Zhao L, Wang X, Differential expression of S100 gene family in human esophageal squamous cell carcinoma: J Cancer Res Clin Oncol, 2004; 130(8); 480-86
20. Lyros O, Lamprecht AK, Nie L, Dickkopf-1 (DKK1) promotes tumor growth via Akt-phosphorylation and independently of Wnt-axis in Barrett’s associated esophageal adenocarcinoma: Am J Cancer Res, 2019; 9(2); 330-46
21. Sukocheva OA, Li B, Due SL, Androgens and esophageal cancer: What do we know?: World J Gastroenterol, 2015; 21(20); 6146-56
22. Lagergren K, Ek WE, Levine D, Polymorphisms in genes of relevance for oestrogen and oxytocin pathways and risk of Barrett’s oesophagus and oesophageal adenocarcinoma: A pooled analysis from the BEACON Consortium: PLoS One, 2015; 10(9); e0138738
23. Yang Z, Zhuang L, Szatmary P, Upregulation of heat shock proteins (HSPA12A, HSP90B1, HSPA4, HSPA5 and HSPA6) in tumour tissues is associated with poor outcomes from HBV-related early-stage hepatocellular carcinoma: Int J Med Sci, 2015; 12(3); 256-63
24. Palumbo P, Lombardi F, Siragusa G, Involvement of NOS2 activity on human glioma cell growth, clonogenic potential, and neurosphere generation: Int J Mol Sci, 2018; 19(9); 2801
25. Tawara K, Bolin C, Koncinsky J, OSM potentiates preintravasation events, increases CTC counts, and promotes breast cancer metastasis to the lung: Breast Cancer Res, 2018; 20(1); 53
26. Motzer RJ, Tannir NM, McDermott DF, Nivolumab plus ipilimumab versus sunitinib in advanced renal-cell carcinoma: N Engl J Med, 2018; 378(14); 1277-90
27. Larkin J, Hodi FS, Wolchok JD, Combined nivolumab and ipilimumab or monotherapy in untreated melanoma: N Engl J Med, 2015; 373(13); 1270-71
28. Overman MJ, Lonardi S, Wong KYM, Durable clinical benefit with nivolumab plus ipilimumab in DNA mismatch repair-deficient/microsatellite instability-high metastatic colorectal cancer: J Clin Oncol, 2018; 36(8); 773-79
29. Lin EW, Karakasheva TA, Hicks PD, The tumor microenvironment in esophageal cancer: Oncogene, 2016; 35(41); 5337-49
30. Mitchell MJ, King MR, Leukocytes as carriers for targeted cancer drug delivery: Expert Opin Drug Deliv, 2015; 12(3); 375-92
31. Stefanidakis M, Koivunen E, Cell-surface association between matrix metalloproteinases and integrins: Role of the complexes in leukocyte migration and cancer progression: Blood, 2006; 108(5); 1441-50
32. Liu D, Zhang R, Wu J, Interleukin-17A promotes esophageal adenocarcinoma cell invasiveness through ROS-dependent, NF-kappaB-mediated MMP-2/9 activation: Oncol Rep, 2017; 37(3); 1779-85
33. Shrivastava MS, Hussain Z, Giricz O, Targeting chemokine pathways in esophageal adenocarcinoma: Cell Cycle, 2014; 13(21); 3320-27
34. Yan S, Zhou C, Zhang W, beta-Catenin/TCF pathway upregulates STAT3 expression in human esophageal squamous cell carcinoma: Cancer Lett, 2008; 271(1); 85-97
35. Hatata T, Higaki K, Tatebe S, Immunohistochemical study of nuclear factor-kappaB expression in esophageal squamous cell carcinoma: Prognostic significance and sensitivity to treatment with 5-FU: Dis Esophagus, 2012; 25(8); 716-22
Figures
Figure 1. The workflow of this study. DE – differentially expressed; GO – gene ontology; KEGG – Kyoto Encyclopedia of Genes and Genomes; TFs – transcription factors.Figure 2. Identification of the differentially expressed (DE) immune genes. (A, B) Volcano plot and the heatmap of the DE genes. (C, D) Volcano plot and the heatmap of the DE immune genes.Figure 3. Functions and transcription factors (TFs) enrichment analysis of the differentially expressed (DE) immune genes. (A) Gene ontology (GO) terms. (B) Kyoto Encyclopedia of Genes and Genomes (KEGG) terms. (C) A DE immune genes-TFs network.Figure 4. Construction of the model based on the training group. (A) Univariate Cox analysis. (B, C) Lasso regression. (D) Multivariate Cox analysis. (E) The expression of 7 DE immune genes in esophageal carcinoma patients.Figure 5. (A–G) The expression of 7 DE immune genes between normal and esophageal carcinoma samples in the Oncomine database.Figure 6. Evaluation of the prognostic signature in the training group. (A) Overall survival (OS) in the training cohort. (B) Time-dependent receiver operating characteristic (ROC) curve analysis in the training cohort. (C) The risk score distribution plot in the training cohort. (D) Survival status plot in the training cohort. (E) Heatmap of risk genes in the training cohort.Figure 7. Validation of the prognostic model in the testing and entire cohort. (A) Overall survival (OS) in the testing group. (B) The receiver operating characteristic (ROC) curve in the testing group. (C) OS in the entire group. (D) The ROC curve in the entire group.Figure 8. Evaluation of the prognostic signature in the validating cohorts. (A) The risk score distribution plot in the testing cohort. (B) Survival status plots in the testing cohort. (C) Heatmap of risk genes in the testing cohort. (D) The risk score distribution plot in the entire cohort. (E) Survival status plots in the entire cohort. (F) Heatmap of risk genes in the entire cohort.Figure 9. Clinical utility of the model in the entire cohort. (A) Univariate Cox analysis. (B) Multivariate Cox analysis. (C) The receiver operating characteristic (ROC) curve of the prognostic variables in the entire group at 1 year.Figure 10. Application of the model in both subtypes of esophageal carcinoma (EC). (A) The expression of the DE immune genes in adenocarcinoma of EC. (B) The expression of the DE immune genes in squamous cell carcinoma of EC. (C) Survival analysis of the risk model in adenocarcinoma of EC. (D) Survival analysis of the risk model in squamous cell carcinoma of EC. Tables
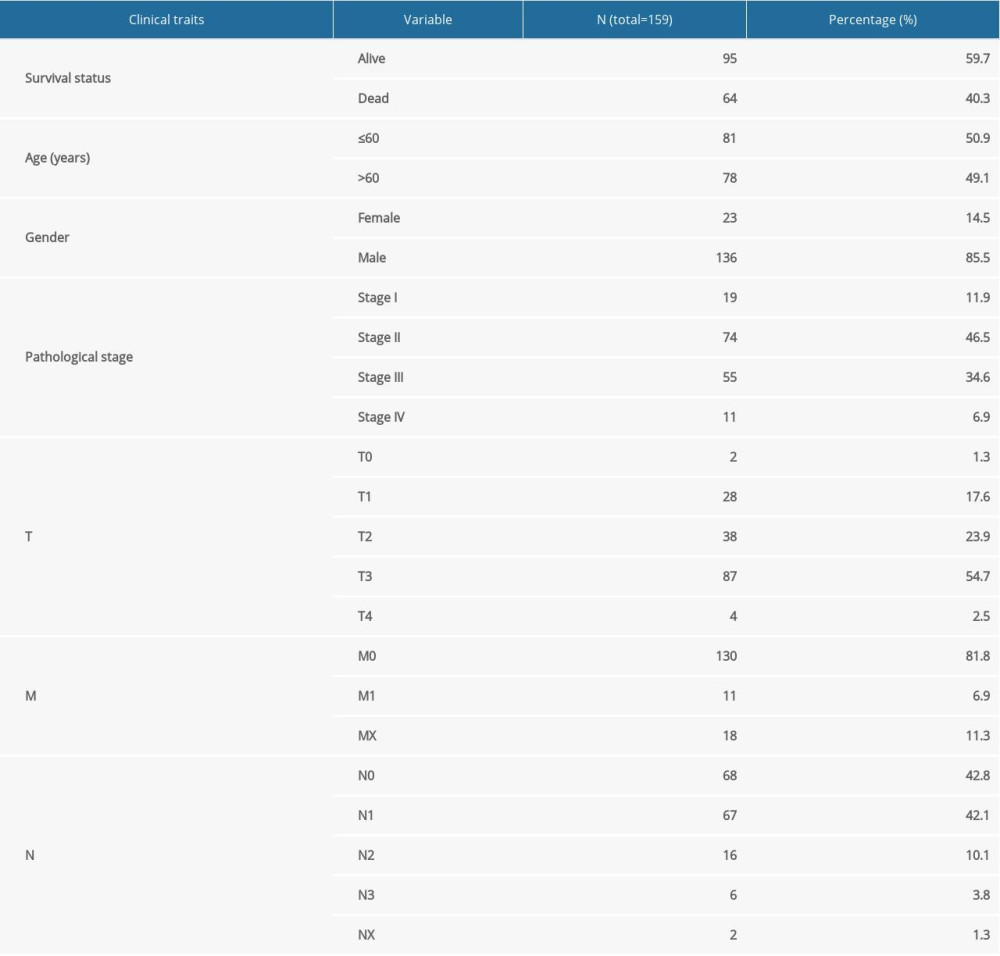 Table 1. Clinical information of the 159 esophageal carcinoma patients in the entire cohort.
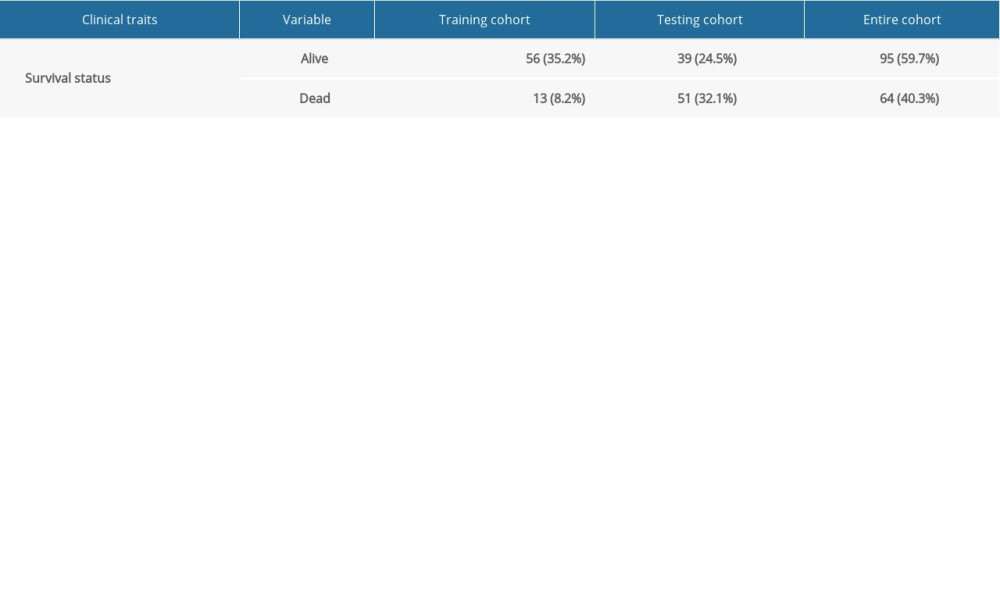 Table 2. Grouping of the esophageal carcinoma patients.
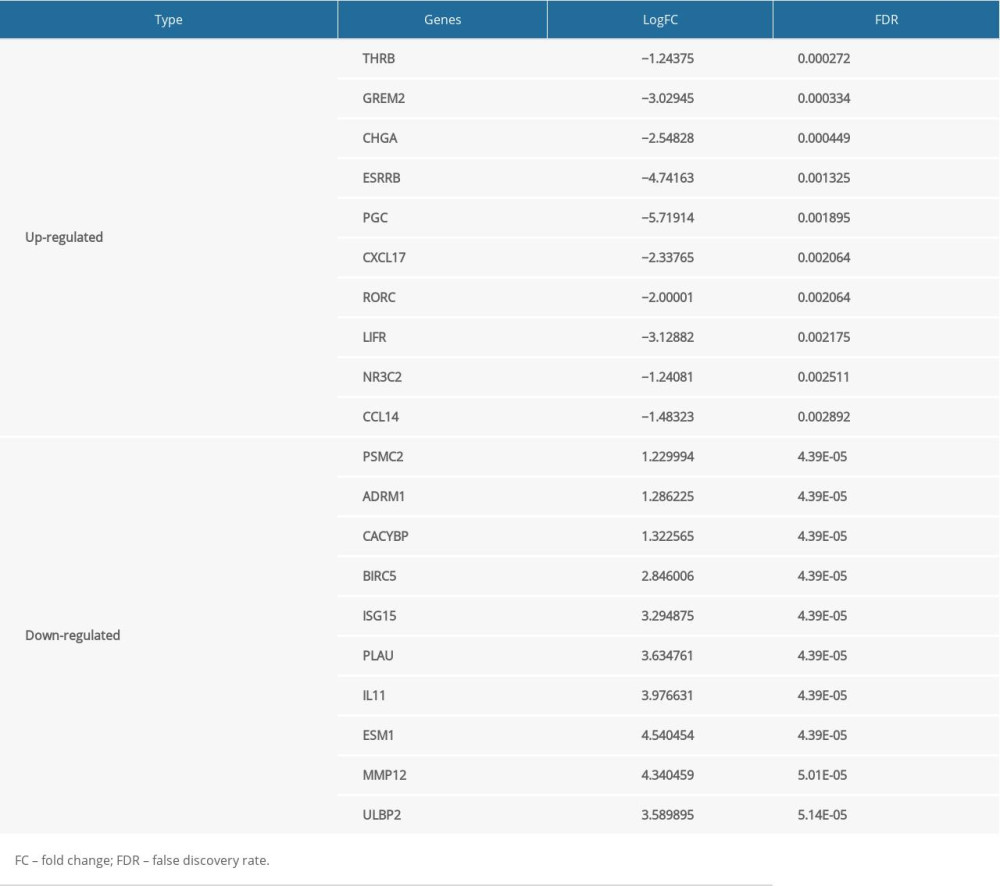 Table 3. The top 10 upregulated and downregulated differentially expressed immune genes.Table 1. Clinical information of the 159 esophageal carcinoma patients in the entire cohort.Table 2. Grouping of the esophageal carcinoma patients.Table 3. The top 10 upregulated and downregulated differentially expressed immune genes.
 In Press
06 Mar 2024 : Clinical Research
Comparison of Outcomes between Single-Level and Double-Level Corpectomy in Thoracolumbar Reconstruction: A ...Med Sci Monit In Press; DOI: 10.12659/MSM.943797
21 Mar 2024 : Meta-Analysis
Economic Evaluation of COVID-19 Screening Tests and Surveillance Strategies in Low-Income, Middle-Income, a...Med Sci Monit In Press; DOI: 10.12659/MSM.943863
10 Apr 2024 : Clinical Research
Predicting Acute Cardiovascular Complications in COVID-19: Insights from a Specialized Cardiac Referral Dep...Med Sci Monit In Press; DOI: 10.12659/MSM.942612
06 Mar 2024 : Clinical Research
Enhanced Surgical Outcomes of Popliteal Cyst Excision: A Retrospective Study Comparing Arthroscopic Debride...Med Sci Monit In Press; DOI: 10.12659/MSM.941102
Most Viewed Current Articles
17 Jan 2024 : Review article
Vaccination Guidelines for Pregnant Women: Addressing COVID-19 and the Omicron VariantDOI :10.12659/MSM.942799
Med Sci Monit 2024; 30:e942799
14 Dec 2022 : Clinical Research
Prevalence and Variability of Allergen-Specific Immunoglobulin E in Patients with Elevated Tryptase LevelsDOI :10.12659/MSM.937990
Med Sci Monit 2022; 28:e937990
16 May 2023 : Clinical Research
Electrophysiological Testing for an Auditory Processing Disorder and Reading Performance in 54 School Stude...DOI :10.12659/MSM.940387
Med Sci Monit 2023; 29:e940387
01 Jan 2022 : Editorial
Editorial: Current Status of Oral Antiviral Drug Treatments for SARS-CoV-2 Infection in Non-Hospitalized Pa...DOI :10.12659/MSM.935952
Med Sci Monit 2022; 28:e935952