19 June 2020: Clinical Research
Association between Cardiorespiratory Fitness, Relative Grip Strength with Non-Alcoholic Fatty Liver Disease
Li Hao1ABCDE, Zhengzhen Wang1ACDEG*, Yan Wang1B, Juan Wang2CD, Zhipeng Zeng3FDOI: 10.12659/MSM.923015
Med Sci Monit 2020; 26:e923015


Abstract
BACKGROUND: Non-alcoholic fatty liver disease (NAFLD) is a common clinical syndrome with no medications for long-term management. At present, diet control and weight loss are 2 major lifestyle components to reduce the risk of NAFLD. However, other lifestyle components such as cardiorespiratory fitness (CRF) and grip strength (GS) have been neglected in research. This study was to investigate the correlation between CRF, relative GS (RGS), and NAFLD among a male study population.
MATERIAL AND METHODS: We screened 1126 men who underwent comprehensive health checks. The participants were divided into an NAFLD group (n=224) and a non-NAFLD group (n=902). The clinical data analyzed included anthropometry, biochemical examination, CRF measurement, and GS calculation were recorded, and the dose-response association between maximal oxygen uptake (VO₂max), RGS, and NAFLD. Stepwise logistic regression analysis was conducted to establish a predictive model of NAFLD.
RESULTS: VO₂max <30 mL/kg⁻¹·min⁻¹ was not associated with the risk of NAFLD (P>0.05). When VO₂max was >30 mL/kg⁻¹·min⁻¹, the risk of NAFLD decreased obviously (P=0.007), suggesting a dose-response relationship between VO₂max and NAFLD risk. With the increase of RGS, the risk of NAFLD decreased prominently (P<0.001), which indicated a dose-response relationship between RGS and NAFLD risk. We also found that body fat percentage, body mass index, systolic blood pressure, diastolic blood pressure, total cholesterol and triglycerides were risk factors, whereas VO₂max >30 mL/kg⁻¹·min⁻¹, RGS, and high-density lipoprotein cholesterol were protective factors for NAFLD. The area under the curve (AUC) of the predictive model of NAFLD was 0.819 (95% confidence interval [CI]: 0.790–0.847, P=0.174). The sensitivity and specificity were 80.4% and 67.8%, respectively.
CONCLUSIONS: In the male study population, VO₂max and RGS were negatively correlated with the risk of NAFLD, thus, the risk of NAFLD could thus be reduced by improving VO₂max and RGS in this population.
Keywords: Fatty Liver, Hand Strength, Rehabilitation, cardiorespiratory fitness, Non-alcoholic fatty liver disease, Risk, young adult
Background
Non-alcoholic fatty liver disease (NAFLD) is a common clinical syndrome characterized by excessive intracellular fat deposition; it is an acquired metabolic stress liver injury closely related to insulin resistance and genetic susceptibility [1]. With the globalization trend of obesity and its related metabolic syndromes, NAFLD has gradually been recognized as an important cause of chronic liver disease [2–4]. Previous studies have shown that the prevalence of NAFLD in adults is up to 10–30% [4,5], and is strongly associated with metabolic disturbances and an increased risk of cardiovascular diseases and type 2 diabetes [6–8]. Therefore, it is of clinical value for clinicians to identify and treat the patients with NAFLD as soon as possible.
To date, no medications for the long-term management of NAFLD have been approved, and diet control and weight loss are 2 major components included in the guidelines for the prevention and management of NAFLD [9,10]. Other lifestyle components, however, are often neglected such as cardiorespiratory fitness (CRF) and grip strength (GS), which are closely associated with cardio-metabolic health [11,12]. CRF, when assessed as part of the maximal oxygen uptake (VO2max), reflects the ability of respiratory and circulatory systems, as well as the ability of muscle tissues to provide oxygen during continuous physical activity. The American Heart Association proposed that CRF can be used as a potential screening tool for the assessment of health outcomes [13]. Early studies reported that CRF at a low level was related to the risk of several chronic diseases, as well as all-cause mortality, cardiovascular disease, and cancers [13–15], while elevated CRF levels had a protective effect on health outcomes [13].
GS is a simple and practicable indicator of overall muscle strength for measuring the maximum static force that one hand can exert around a dynamometer with good retest reliability [16,17]. Research suggests that the predictive efficacy of muscle strength is superior to muscle mass in poor outcomes [18–20], and low GS has been assessed in connection with health damage and higher all-cause mortality [18–22]. In physical fitness tests, GS is often expressed as relative GS (RGS) to obtain a scientific and effective physical strength assessment. Due to its predictive validity and simplicity, GS may be a potential screening tool for clinicians to use to improve human muscle health.
Although experimental studies have reported the associations between CRF and NAFLD in animals, limited data exist in humans [23,24]. Research has focused on prevalence, all-cause mortality, and adolescent populations. In addition, few studies have evaluated the link between RGS and NAFLD risk. The objective of our investigation was to assess the correlation between CRF, RGS, and NAFLD risk in a population-based sample of male adults.
Material and Methods
PARTICIPANTS:
Participants were recruited from the Multi-center Application Research on Fitness Test and Exercise Management project of China Health Foundation. A total of 1126 male participants were enrolled; participants underwent comprehensive health checks. The participants were divided into an NAFLD group (n=224) and a non-NAFLD group (n=902). The clinical data recorded included anthropometry, biochemical examination, CRF measurement, and GS calculations. Individuals included were 20–60 years old, from an urban population, and without cardiovascular, pulmonary, or musculoskeletal diseases.
ANTHROPOMETRIC INDICATORS:
The anthropometric indicators were recorded by a wireless body composition monitor (MC-180, TANITA Corp., Tokyo, Japan) and a sphygmomanometer (M500, OMRON Healthcare Co., Ltd., Kyoto, Japan). Before the body assessments, the participants were asked to: fast for 3 hours, avoid strenuous activities within 24 hours, empty their bowels, and wear light clothing without accessories. The age, body fat percentage (%), body mass index (BMI) measured by weight/height (kg/m2), waist-to-hip ratio (WHR), systolic blood pressure (SBP), and diastolic blood pressure (DBP) were recorded.
LABORATORY EXAMINATION:
The participants were not allowed to smoke or drink the day before the test, and they were asked to fast for at least 12 hours before the venous blood draw was taken (from the elbow area) in the morning. The laboratory tests included total cholesterol (TC), triglyceride (TG), high-density lipoprotein cholesterol (HDL-C), low-density lipoprotein cholesterol (LDL-C), and fasting blood-glucose (FBG).
CRF MEASUREMENT:
The CRF test was carried out using the YMCA power car scheme (YMCA Submaximal Cycle Ergometer Test) [25]. According to the test requirements, for the first stage the load was 150 kg/min) at 50 rpm of the rotation speed, and individuals were continuously measured 2–4 levels with moving at least 3 minutes of each stage. The stable heart rates of study participants were controlled between 110 beats per minute (bpm) and 70% of the heart rate reserve (85% of the age-predicted heart rate) in the continuous tests, and the heart rates at the 45–60 seconds of the 2nd and 3rd minute were recorded. If the heart rate changed more than 5 bpm, the movement was extended for 1 minute at this power. The heart rate and power of 2 points in continuous stages with stable heart rates of 110 bpm or more were selected as a straight line. The extended line of the straight line was used to determine the predicted maximum power corresponding to the age-predicted maximum heart rate, and then the VO2max was calculated according to the standard formula:
GS CALCULATION:
GS was measured using a Jamar dynamometer (HK6000, Hengkangjiaye Corp., China). The study participants feet were naturally separated into an upright position, with their arms hanging down, then the dynamometers were held by one hand and the GS values were recorded [26]. The GS was detected with the dominant hand 3 times, taking the maximum value. The calculation of RGS is the ratio of GS and weight.
DIAGNOSTIC CRITERIA:
The audiovisual diagnosis of NAFLD were based on a B ultrasound diagnostic instrument (SSA-790A (Aplio XG), TOSHIBA Corp., Tokyo, Japan) with 3.5 MHz of the transducer frequency. The criteria were as follows: 1) diffuse punctate hyperechoic field near the liver area, a higher intensity of echo than in spleen and kidney, and focal hyperecho (noted in a few participants); 2) the attenuation of echo in far field and sparse light spots; 3) unclear intrahepatic tube structures; 4) mild or severe swelling of liver, and the blunted leading edge of liver.
STATISTICAL ANALYSIS:
Statistical analysis was performed using SPSS 23.0 (SPSS, Inc., Chicago, IL, USA). Measurement data were presented as the mean±standard deviation (mean±SD) or [M (Q1, Q3)] and analyzed by
The interaction of independent variables was identified using a linear model with age and weight as the control variable, other indicators as dependent variables, VO2max, RGS, and centralized VO2max * centralized RGS as independent variables. After adjusting the confounding factors of the age, BMI, body fat percentage, SBP, TG, and LDL, the restrictive cubic spline (RCS) model based on logistic regression was used. The dose-response association between VO2max, RGS, and NAFLD were analyzed, and the quantile 5%, 25%, 75%, and 95% and the quantile 25%, 50%, and 75% as nodes of the model were selected, respectively.
Results
THE BASELINE DATA OF INDIVIDUALS:
A total of 1126 male participants were included in this study that comprised 224 NAFLD cases and 902 non-NAFLD individuals, with the mean age of (36.56±8.93) years, the average BMI of (24.59±3.50), the mean VO2max of 31.76±5.06 (range 19.60–66.15) and the mean RGS of 1.58±0.35 (range 0.56–3.02). As shown in Table 1, the results found that VO2max was associated with the body fat percentage, BMI, WHR, TC, TG, and FBG, whereas RGS was related to the body fat percentage, BMI, WHR, DBP, TC, TG, LDL-C, HDL-C, and FBG (P<0.05).
DESCRIPTIVE STATISTICS AND CORRELATIONS BETWEEN INDEPENDENT AND DEPENDENT VARIABLES:
In Table 2, the results show that the body fat percentage, BMI, WHR, SBP, DBP, TC, TG, and FBG in the NAFLD group were significantly higher than that in the non-NAFLD group (P<0.05). While the HDL-C and RGS in the NAFLD group were lower than that in the non-NAFLD group (P<0.001).
The correlations between VO2max and various variables are presented in Table 2. For each unit increased in VO2max, the body fat percentage of non-NAFLD individuals decreased by 0.27% on average, BMI by 1.8 kg/m2, WHR by 0.21, the log of TC by 0.08, while the reciprocal of FBG increased by 0.04 after adjusting the effect of age (P<0.05). This indicated that increased VO2max in the non-NAFLD group can reduce the levels of body fat percentage, BMI, WHR, TG, and FBG.
Our findings revealed that with the RGS increase of one unit, the mean body fat percentage, BMI, WHR, DBP and the logarithm of TG in the non-NAFLD group decreased by 0.52%, 0.54 kg/m2, 0.48, 0.07 mmHg, and 0.25 mg/dL, respectively (
As displayed in Table 3, no statistical differences were found in regression coefficients of the interactive items in the linear regression model, indicating no interaction between VO2max, RGS, and NAFLD.
DOSE-RESPONSE RELATIONSHIP BETWEEN CRF, RGS, AND NAFLD RISK:
The restricted cubic spline regression curve of VO2max and NAFLD risk are shown in Figure 1. The results found that VO2max <30 mL/kg−1·min−1 was not associated with the risk of NAFLD (P>0.05). When VO2max was >3 0 mL/kg−1·min−1, the risk of NAFLD decreased obviously (P=0.007), suggesting a dose-response relationship between VO2max and NAFLD risk. In Figure 2, with the increase of the RGS, the risk of NAFLD decreased prominently (P<0.001), which indicated a dose-response relationship between RGS and the risk of NAFLD.
LOGISTIC REGRESSION ANALYSIS FOR THE RISK OF NAFLD:
Regression analysis was used to assess the associations between NAFLD risk and the relevant indicators in Table 4. The results of single-factor logistic regression analysis showed that statistical differences were discovered in age (odds ratio [OR]=1.051, 95% CI: 1.033–1.069, P<0.05), VO2max >30 mL/kg−1·min−1 (OR=0.670, 95% CI: 0.577–0.777, P<0.001), RGS (OR=0.171, 95% CI: 0.106–0.275, P<0.001), body fat percentage (OR=1.212, 95% CI: 1.170–1.255, P<0.001), BMI (OR=1.335, 95% CI: 1.267–1.407, P<0.001), WHR (OR=1.373, 95% CI: 1.289–1.464, P<0.001), SBP (OR=1.083, 95% CI: 1.069–1.098, P<0.001), DBP (OR=1.023, 95% CI: 1.009–1.037, P<0.001), TC (OR=1.270, 95% CI: 1.108–1.457, P<0.001), TG (OR=1.292, 95% CI: 1.184–1.408, P<0.001), and HDL-C (OR=0.263, 95% CI: 0.151–0.459, P<0.001). There were differences in VO2max >30 mL/kg−1·min−1 (OR=0.686, 95% CI: 0.586–0.802, P<0.001), RGS (OR=0.642, 95% CI: 0.503–0.842, P<0.001), body fat percentage (OR=1.091, 95% CI: 1.034–1.152, P<0.01), BMI (OR=1.314, 95% CI: 1.244–1.388, P<0.001), SBP (OR=1.085, 95% CI: 1.073–1.097, P<0.01), DBP (OR=1.039, 95% CI: 1.018–1.061, P<0.05), TC (OR=1.154, 95% CI: 1.067–1.248, P<0.01), TG (OR=1.107, 95% CI: 1.010–1.214, P<0.05), and HDL-C (OR=0.332, 95% CI: 0.184–0.599, P<0.001) on the basis of stepwise logistic regression analysis. It was indicated that body fat percentage, BMI, SBP, DBP, TC, and TG were risk factors, and VO2max >30 mL/kg−1·min−1, RGS, and HDL-C were protective factors for NAFLD.
The predictive model of NAFLD was established using the variables screened by stepwise logistic regression analysis. The receiver operating characteristic (ROC) curve for predicting the risk of NAFLD are shown in Figure 3. The area under the curve (AUC) was 0.819 (95% CI: 0.790–0.847, P=0.174). The sensitivity and specificity were 80.4% and 67.8%, respectively.
Discussion
In this present study, we assessed the correlation between CRF, RGS, and the risk of NAFLD in a population-based sample of male adults. The key findings revealed that the risk of NAFLD gradually decreased with the increase of VO2max (>30 mL/kg−1·min−1) and RGS. In addition, we also found that body fat percentage, BMI, SBP, DBP, TC, and TG were risk factors, and VO2max >30 mL/kg−1·min−1, RGS, and HDL-C were protective factors for NAFLD. The AUC of the predictive model of NAFLD was 0.819 (95% CI: 0.790–0.847,
NAFLD is one of the most common chronic liver diseases in numerous Asia-Pacific countries including China [27] NAFLD encompasses a wide range of diseases from simple steatosis, non-alcoholic steatohepatitis, fibrosis, and even cirrhosis [28]. NAFLD as a public health concern that is predictive of cardiovascular diseases and greater mortality [29,30]. Previous studies discovered that lower VO2max levels were associated with poor outcomes of several chronic diseases, while studies on NAFLD have been rarely reported. To the best of our knowledge, previous investigations between CRF and NAFLD mainly focused on the correlation. In our study, for each one unit increase in VO2max, the body fat percentage of non-NAFLD individuals decreased by 0.27% on average, BMI by 1.8 kg/m2, WHR by 0.21, and the log of TC by 0.08, whereas the reciprocal of FBG increased by 0.04 after adjusting the effect of age. We discovered when VO2max was > 30 mL/kg−1·min−1, the risk of NAFLD decreased, indicating elevated VO2max levels may decrease the NAFLD risk.
Interestingly, liver and muscle, as active endocrine organs, can secrete substances with metabolic effects [31,32]. Early studies mentioned that NAFLD and sarcopenia may have a possible connection with common pathogenesis such as insulin resistance and chronic inflammation [33–35]. Low muscle mass is a common clinical manifestation in patients with liver cirrhosis which is related to the morbidity and mortality. However, increased muscle mass cannot prevent the decrease in muscle strength, and low muscle mass is also not a leading cause of the inverse relation between muscle strength and mortality [36]. Although some studies have focused on muscle mass, there are no conclusive statements to explain the muscle status in patients with NAFLD. Herein, we investigated the direct relationship between RGS and NAFLD risk. When RGS was increased by one unit, the mean body fat percentage, BMI, WHR, DBP, and the logarithm of TG in the non-NAFLD group decreased by 0.52%, 0.54 kg/m2, 0.48, 0.07 mmHg, and 0.25, respectively, while body fat percentage, BMI, WHR, and TG in the NAFLD group decreased via 0.54%, 0.48 kg/m2, 0.47, and 0.15 mg/dL, respectively. Furthermore, a dose-response relationship between RGS and the risk of NAFLD was founded in our research, and the risk of NAFLD decreased with an increase of the RGS. This indicated that increasing muscle strength may reduce the risk of NAFLD. We also found significant differences in VO2max >30 mL/kg−1·min−1, RGS, body fat percentage, BMI, SBP, DBP, TC, TG, and HDL-C. These findings indicated that body fat percentage, BMI, SBP, DBP, TC, and TG were risk factors, and VO2max >30 mL/kg−1·min−1, RGS, and HDL-C were protective factors for NAFLD. In addition, a predictive model of NAFLD was established and the AUC of ROC curve for predicting NAFLD was 0.819. This suggested that this model could be a predictive tool for patients with NAFLD.
The strengths of the study were that we assessed the effects of CRF and RGS on the risk of NAFLD in a population-based sample of male adults. We found a dose-response relationship between VO2max, RGS and NAFLD risk that may be an effective method to predictive the risk of NAFLD. There were some limitations to our study that warranted caution for interpreting the data. Our study included only 1126 male participants who voluntarily participated in the study, which may present some recruitment bias. The value of VO2max was estimated with a submaximal cycle ergometer test. Additionally, the behavioral habits, nutritional status, socio-economic status, and health care may have confounded the association between the variables under examination.
Conclusions
In summary, our findings suggested a dose-response relationship between VO2max, RGS, and NAFLD risk. With the increase of VO2max (>30 mL/kg−1·min−1) and RGS, the risk of NAFLD gradually decreased. VO2max and RGS were negatively correlated with the risk of NAFLD, which could be reduced by improving VO2max and RGS in this male study population. In addition, we also found that body fat percentage, BMI, SBP, DBP, TC, and TG were risk factors, and VO2max >30 mL/kg−1·min−1, RGS, and HDL-C were protective factors for NAFLD. Thus, CRF and physical exercise should be emphasized to reduce the burden of NAFLD at the population level.
Figures
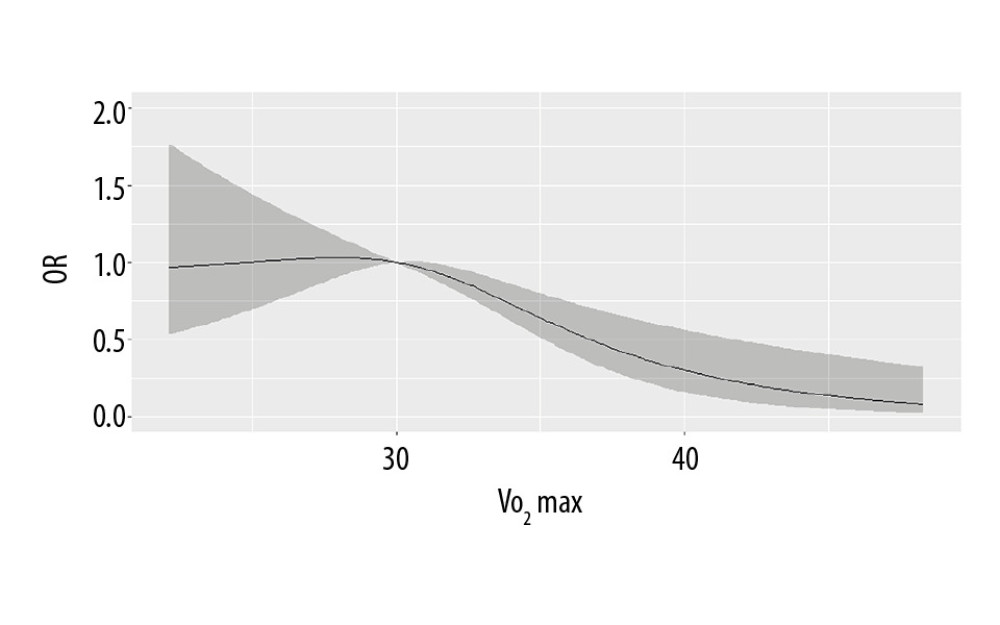 Figure 1. The dose-response relationship between VO2max and non-alcoholic fatty liver disease (NAFLD) risk.
 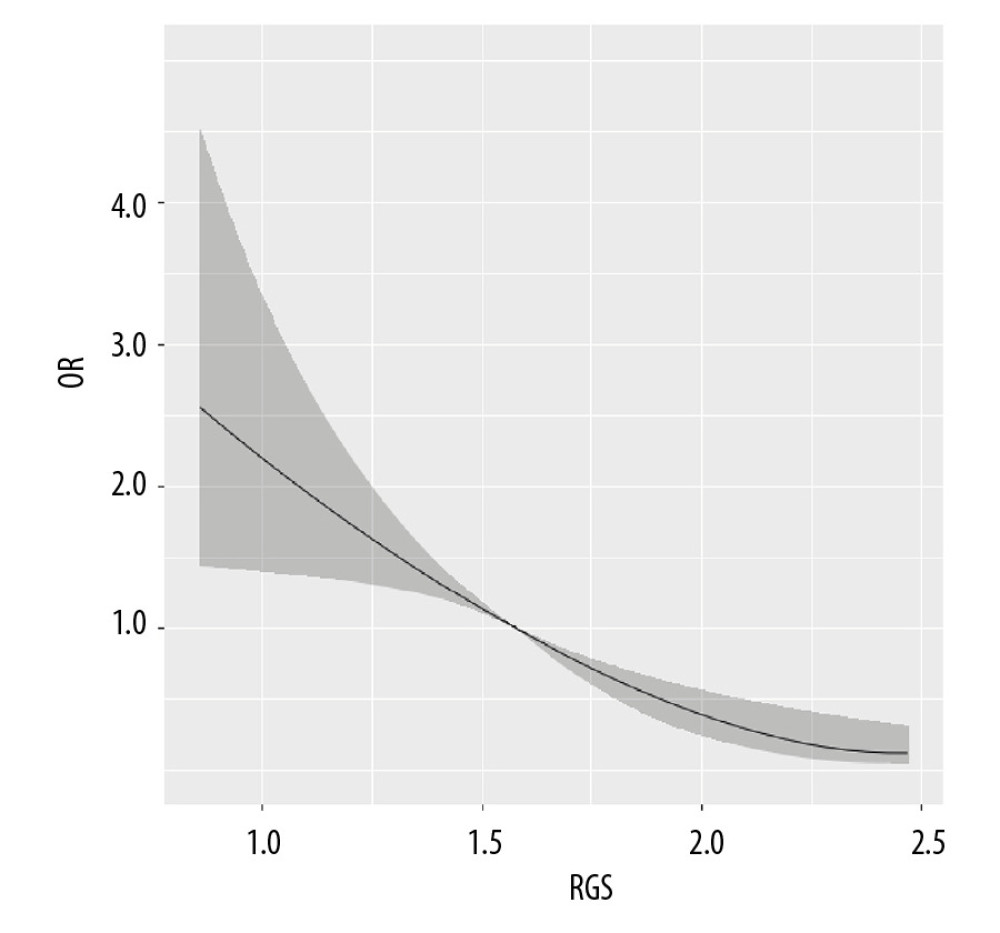 Figure 2. The dose-response relationship between relative grip strength (RGS) and non-alcoholic fatty liver disease (NAFLD) risk.
 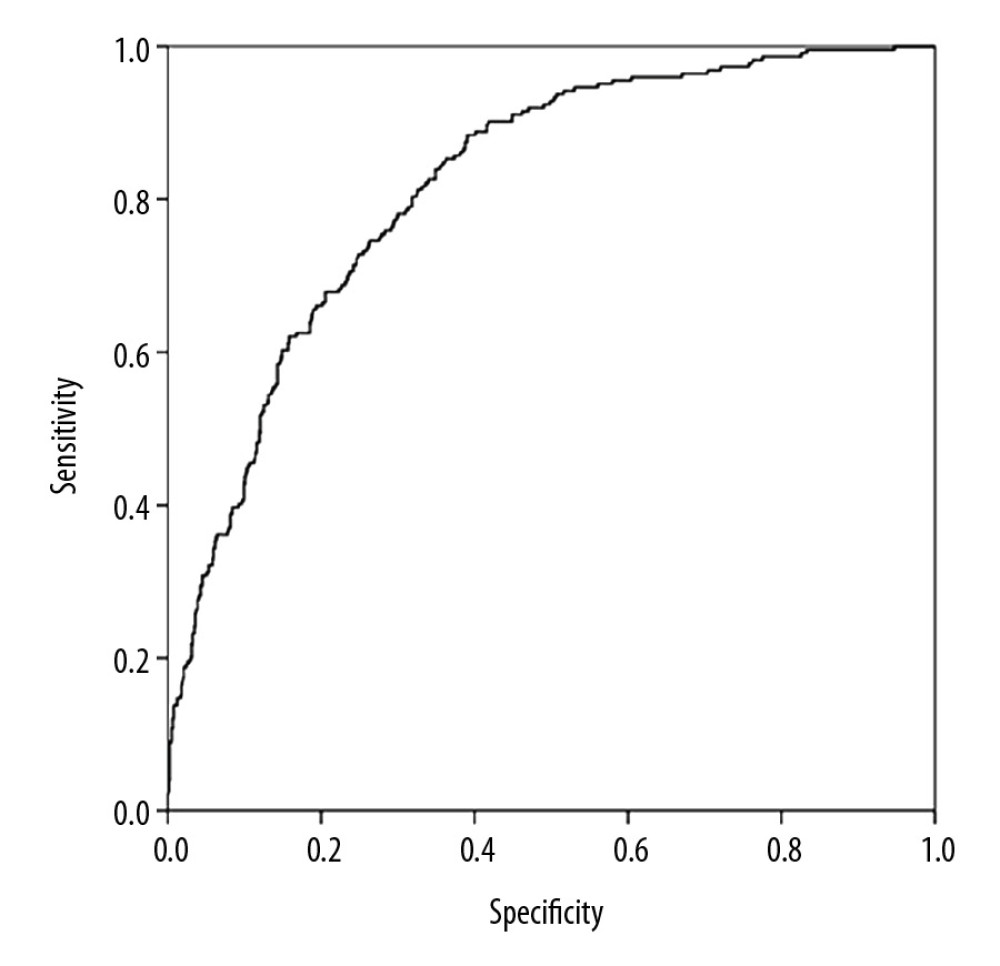 Figure 3. The receiver operating characteristic curve for predicting the risk of non-alcoholic fatty liver disease (NAFLD).
 References
1. Neuschwander-Tetri BA, Non-alcoholic fatty liver disease: BMC Med, 2017; 15; 45
2. Sayiner M, Koenig A, Henry L, Younossi ZM, Epidemiology of nonalcoholic fatty liver disease and nonalcoholic steatohepatitis in the United States and the rest of the world: Clin Liver Dis, 2016; 20(2); 205-14
3. Stefan N, Haring HU, Cusi K, Non-alcoholic fatty liver disease: Causes, diagnosis, cardiometabolic consequences, and treatment strategies: Lancet Diabetes Endocrinol, 2019; 7(4); 313-24
4. Younossi ZM, Non-alcoholic fatty liver disease – a global public health perspective: J Hepatol, 2019; 70(3); 531-44
5. Amarapurkar DN, Hashimoto E, Lesmana LA, How common is non-alcoholic fatty liver disease in the Asia-Pacific region and are there local differences?: J Gastroenterol Hepatol, 2007; 22(6); 788-93
6. Ballestri S, Zona S, Targher G, Nonalcoholic fatty liver disease is associated with an almost twofold increased risk of incident type 2 diabetes and metabolic syndrome. Evidence from a systematic review and meta-analysis: J Gastroenterol Hepatol, 2016; 31(5); 936-44
7. Targher G, Byrne CD, Lonardo A, Non-alcoholic fatty liver disease and risk of incident cardiovascular disease: a meta-analysis: J Hepatol, 2016; 65(3); 589-600
8. Adams LA, Anstee QM, Tilg H, Targher G, Non-alcoholic fatty liver disease and its relationship with cardiovascular disease and other extrahepatic diseases: Gut, 2017; 66(6); 1138-53
9. Marchesini G, Day CP, Dufour JF, EASL-EASD-EASO Clinical Practice Guidelines for the management of non-alcoholic fatty liver disease: J Hepatol, 2016; 64(6); 1388-402
10. Chalasani N, Younossi Z, Lavine JE, The diagnosis and management of non-alcoholic fatty liver disease: Practice Guideline by the American Gastroenterological Association, American Association for the study of liver diseases, and American College of Gastroenterology: Gastroenterology, 2012; 142(7); 1592-609
11. Bueno-Antequera J, Oviedo-Caro MA, Munguia-Izquierdo D, Ideal cardiovascular health and its association with sedentary behaviour and fitness in psychiatric patients. The PsychiActive project: Nutr Metab Cardiovasc Dis, 2018; 28(9); 900-8
12. Ruiz JR, Huybrechts I, Cuenca-Garcia M, Cardiorespiratory fitness and ideal cardiovascular health in European adolescents: Heart, 2015; 101(10); 766-73
13. Ross R, Blair SN, Arena R, Importance of assessing cardiorespiratory fitness in clinical practice: A case for fitness as a clinical vital sign a scientific statement from the American Heart Association: Circulation, 2016; 134(24); E653-99
14. Pozuelo-Carrascosa DP, Alvarez-Bueno C, Cavero-Redondo I, Cardiorespiratory fitness and site-specific risk of cancer in men: a systematic review and meta-analysis: Eur J Cancer, 2019; 113; 58-68
15. Schmid D, Leitzmann MF, Cardiorespiratory fitness as predictor of cancer mortality: A systematic review and meta-analysis: Ann Oncol, 2015; 26(2); 272-78
16. Bohannon RW, Muscle strength: Clinical and prognostic value of hand-grip dynamometry: Curr Opin Clin Nutr Metab Care, 2015; 18(5); 465-70
17. Chen LK, Liu LK, Woo J, Sarcopenia in Asia: Consensus report of the Asian Working Group for Sarcopenia: J Am Med Dir Assoc, 2014; 15(2); 95-101
18. Schaap LA, Koster A, Visser M, Adiposity, muscle mass, and muscle strength in relation to functional decline in older persons: Epidemiol Rev, 2013; 35; 51-65
19. Leong DP, Teo KK, Rangarajan S, Prognostic value of grip strength: findings from the Prospective Urban Rural Epidemiology (PURE) study: Lancet, 2015; 386(9990); 266-73
20. Carson RG, Get a grip: Individual variations in grip strength are a marker of brain health: Neurobiol Aging, 2018; 71; 189-222
21. Kim BJ, Ahn SH, Lee SH, Lower hand grip strength in older adults with non-alcoholic fatty liver disease: A nationwide population-based study: Aging (Albany NY), 2019; 11(13); 4547-60
22. Garcia-Hermoso A, Ramirez-Velez R, Peterson MD, Handgrip and knee extension strength as predictors of cancer mortality: A systematic review and meta-analysis: Scand J Med Sci Sports, 2018; 28(8); 1852-58
23. Croci I, Coombes JS, Sandbakk SB, Non-alcoholic fatty liver disease: Prevalence and all-cause mortality according to sedentary behaviour and cardiorespiratory fitness. The HUNT study: Prog Cardiovasc Dis, 2019; 62(2); 127-34
24. Ramirez-Velez R, Izquierdo M, Correa-Bautista JE, Grip strength moderates the association between anthropometric and body composition indicators and liver fat in youth with an excess of adiposity: J Clin Med, 2018; 7(10); 347-58
25. Golding LA, USA: Yot. YMCA fitness testing and assessment manual, 2000, YMCA of the USA
26. Roberts HC, Denison HJ, Martin HJ, A review of the measurement of grip strength in clinical and epidemiological studies: Towards a standardised approach: Age Ageing, 2011; 40(4); 423-29
27. Seto WK, Yuen MF, Nonalcoholic fatty liver disease in Asia: Emerging perspectives: J Gastroenterol, 2017; 52(2); 164-74
28. Chalasani N, Younossi Z, Lavine JE, The diagnosis and management of non-alcoholic fatty liver disease: Practice Guideline by the American Association for the Study of Liver Diseases, American College of Gastroenterology, and the American Gastroenterological Association: Hepatology, 2012; 55(6); 2005-23
29. Dunn W, Xu RH, Wingard DL, Suspected nonalcoholic fatty liver disease and mortality risk in a population-based cohort study: Am J Gastroenterol, 2008; 103(9); 2263-71
30. Targher G, Day CP, Bonora E, Risk of cardiovascular disease in patients with nonalcoholic fatty liver disease: N Engl J Med, 2010; 363(14); 1341-50
31. Stefan N, Haring HU, The role of hepatokines in metabolism: Nat Rev Endocrinol, 2013; 9(3); 144-52
32. Pedersen BK, Febbraio MA, Muscle as an endocrine organ: Focus on muscle-derived interleukin-6: Physiol Rev, 2008; 88(4); 1379-406
33. De Fre CH, De Fre MA, Kwanten WJ, Sarcopenia in patients with non-alcoholic fatty liver disease: Is it a clinically significant entity?: Obes Rev, 2019; 20(2); 353-63
34. Koo BK, Kim D, Joo SK, Sarcopenia is an independent risk factor for non-alcoholic steatohepatitis and significant fibrosis: J Hepatol, 2017; 66(1); 123-31
35. Lee YH, Jung KS, Kim SU, Sarcopaenia is associated with NAFLD independently of obesity and insulin resistance: Nationwide surveys (KNHANES 2008–2011): J Hepatol, 2015; 63(2); 486-93
36. Goodpaster BH, Park SW, Harris TB, The loss of skeletal muscle strength, mass, and quality in older adults: The health, aging and body composition study: J Gerontol A Biol Sci Med Sci, 2006; 61(10); 1059-64
Figures
Figure 1. The dose-response relationship between VO2max and non-alcoholic fatty liver disease (NAFLD) risk.Figure 2. The dose-response relationship between relative grip strength (RGS) and non-alcoholic fatty liver disease (NAFLD) risk.Figure 3. The receiver operating characteristic curve for predicting the risk of non-alcoholic fatty liver disease (NAFLD). Tables
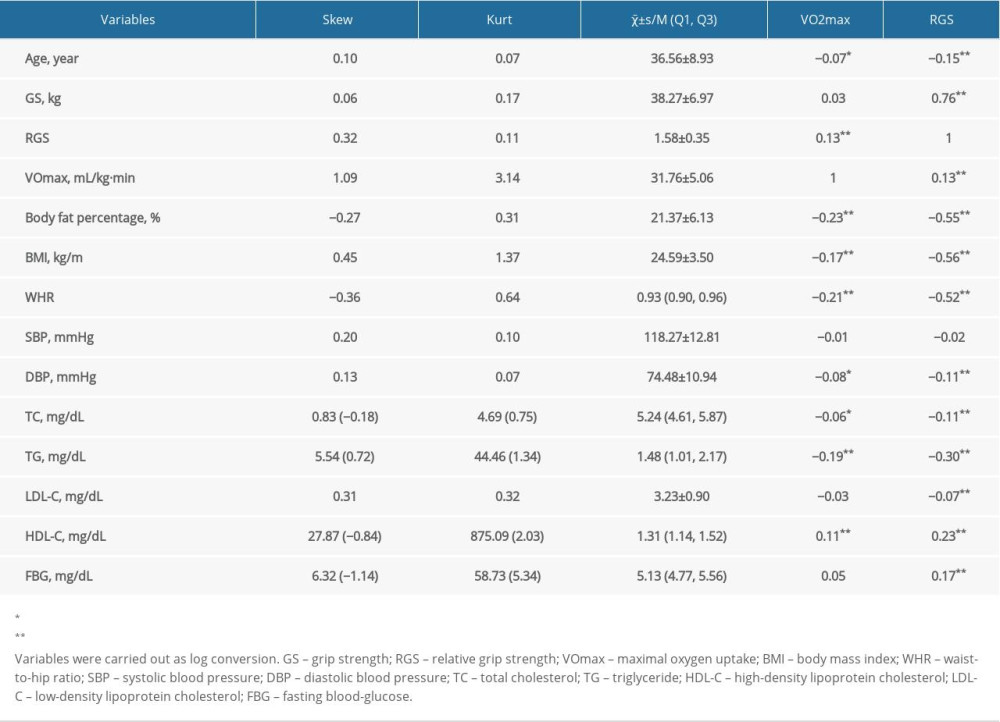 Table 1. The characteristics of the male study population.
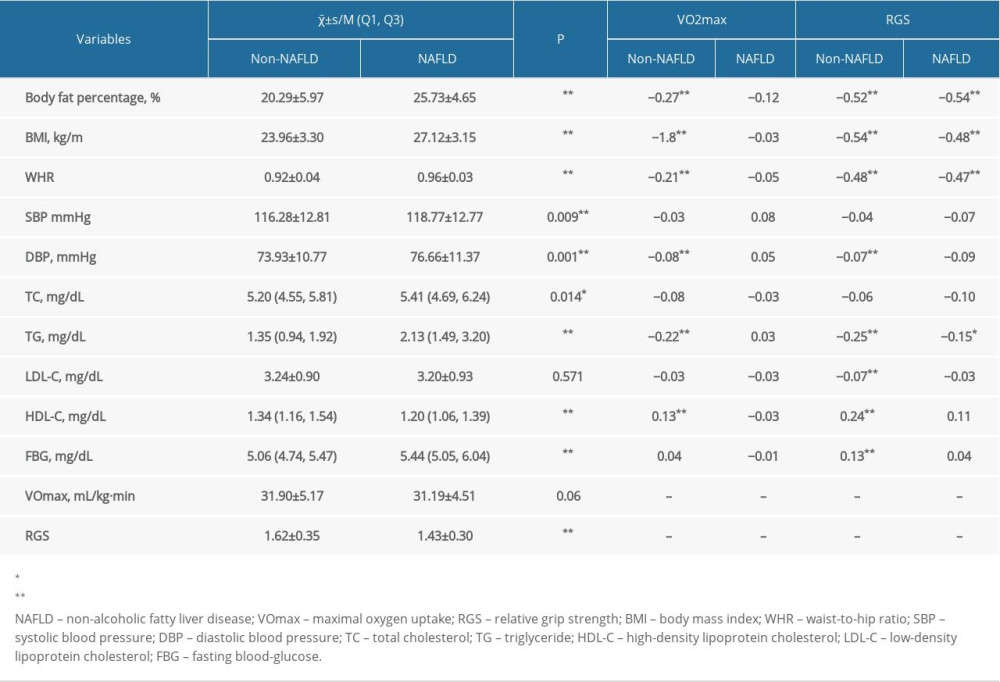 Table 2. Effects of VO2max and RGS on male study population.
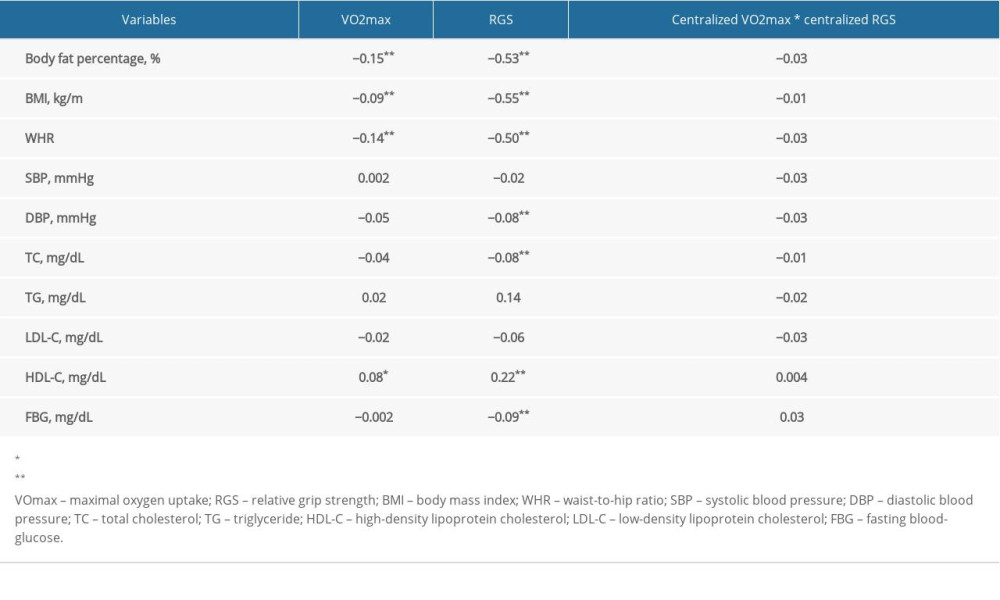 Table 3. Effects of VO2max and RGS on general data.
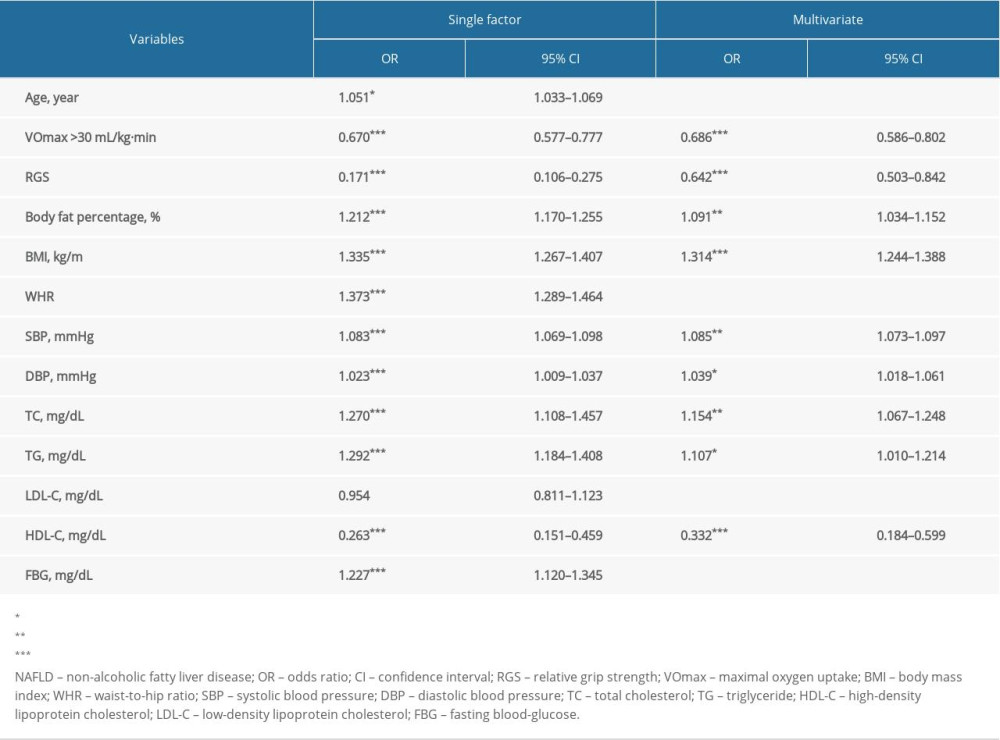 Table 4. Logistic regression analysis for the risk of NAFLD.Table 1. The characteristics of the male study population.Table 2. Effects of VO2max and RGS on male study population.Table 3. Effects of VO2max and RGS on general data.Table 4. Logistic regression analysis for the risk of NAFLD.
 In Press
05 Mar 2024 : Clinical Research
Role of Critical Shoulder Angle in Degenerative Type Rotator Cuff Tears: A Turkish Cohort StudyMed Sci Monit In Press; DOI: 10.12659/MSM.943703
06 Mar 2024 : Clinical Research
Comparison of Outcomes between Single-Level and Double-Level Corpectomy in Thoracolumbar Reconstruction: A ...Med Sci Monit In Press; DOI: 10.12659/MSM.943797
21 Mar 2024 : Meta-Analysis
Economic Evaluation of COVID-19 Screening Tests and Surveillance Strategies in Low-Income, Middle-Income, a...Med Sci Monit In Press; DOI: 10.12659/MSM.943863
10 Apr 2024 : Clinical Research
Predicting Acute Cardiovascular Complications in COVID-19: Insights from a Specialized Cardiac Referral Dep...Med Sci Monit In Press; DOI: 10.12659/MSM.942612
Most Viewed Current Articles
17 Jan 2024 : Review article
Vaccination Guidelines for Pregnant Women: Addressing COVID-19 and the Omicron VariantDOI :10.12659/MSM.942799
Med Sci Monit 2024; 30:e942799
14 Dec 2022 : Clinical Research
Prevalence and Variability of Allergen-Specific Immunoglobulin E in Patients with Elevated Tryptase LevelsDOI :10.12659/MSM.937990
Med Sci Monit 2022; 28:e937990
16 May 2023 : Clinical Research
Electrophysiological Testing for an Auditory Processing Disorder and Reading Performance in 54 School Stude...DOI :10.12659/MSM.940387
Med Sci Monit 2023; 29:e940387
01 Jan 2022 : Editorial
Editorial: Current Status of Oral Antiviral Drug Treatments for SARS-CoV-2 Infection in Non-Hospitalized Pa...DOI :10.12659/MSM.935952
Med Sci Monit 2022; 28:e935952