12 March 2022: Lab/In Vitro Research
Downregulated Expression of RIPOR3 Correlated with Immune Infiltrates Predicts Poor Prognosis in Oral Tongue Cancer
Kai Zhang1BCDE, Junlong Da1F, Xiaoyao Liu1F, Xinpeng Liu1F, Jianqun Wang1F, Han Jin1D, Ying Li1D, Bin Zhang12AG*DOI: 10.12659/MSM.935055
Med Sci Monit 2022; 28:e935055


Abstract
BACKGROUND: Tongue cancer is the most prevalent of head and neck squamous cell carcinomas, including base of tongue cancer (BOT) and oral squamous cell carcinoma of the mobile tongue (OTSCC). We aimed to investigate the role of RIPOR3 in tumorigenesis and its development as a potential prognostic biomarker for tongue cancer, especially OTSCC.
MATERIAL AND METHODS: Associations of expression, clinical pathologic features, and overall survival were analyzed by logistic regression, multivariate Cox analysis, and Kaplan-Meier methods. Gene set enrichment analysis (GSEA) and the CIBERSORT algorithm were performed to determine the correlation between RIPOR3 and tumor immune infiltration. cBioPortal was used for methylation and copy number variation (CNV) analysis. The Human Protein Atlas (HPA) and GSE31056 dataset were used for further external validation.
RESULTS: RIPOR3 expression in OTSCC was significantly associated with various clinicopathological parameters. Kaplan-Meier survival analysis showed that OTSCC with low RIPOR3 expression had a worse prognosis than that with high RIPOR3 expression. Multivariate analysis revealed that lower RIPOR3 expression was an independent prognostic factor for poor prognosis. GSEA and Neighbor Gene Network analysis showed RIPOR3 expression was related with the modulation and function of the immune-related pathway. Methylation level and CNV analysis showed that the downregulated expression of RIPOR3 was significantly related to hypermethylation but not to CNV. Finally, high RIPOR3 expression was validated at the protein level using the HPA database and GSE31056 dataset.
CONCLUSIONS: These findings suggested that RIPOR3 might serve as a promising prognostic biomarker and is related to the immune cell infiltration of OTSCC.
Keywords: Immunity, Squamous Cell Carcinoma of Head and Neck, Tongue Diseases, Adult, Aged, 80 and over, carcinogenesis, Carcinoma, Squamous Cell, DNA Copy Number Variations, DNA Methylation, Down-Regulation, Female, Humans, Male, Mouth Neoplasms, RNA, Neoplasm, Tongue Neoplasms, rac GTP-Binding Proteins
Background
Head and neck tumors, 90% of which are composed of squamous cell carcinoma (HNSCC), are the sixth most common cancer worldwide [1]. Oral cancer accounts for 24% of HNSCC and is a major source of morbidity and mortality [2–4]. The tongue has a special anatomical position and is the main organ that participates in eating and taste feedback. When a patient encounters any discomfort, such as ulcers or pain, the patient should be evaluated for oral cancer at the first occurrence [5]; however, the incidence of advanced tumors (stage III–IV TNM) is still about 30% to 35% [6]. In patients under 40 years of age, the incidence of oral tongue cancer has increased significantly, by 60% [7]. Anatomically, the tongue is divided into the anterior two-thirds of the mobile body and the posterior third of the oropharyngeal area (the base of the tongue) by the V-shaped line, the sulcus terminalis. Pathologically, the cancer of the mobile tongue belongs to oral cancer, and tongue base cancer belongs to oropharyngeal cancer, which is completely different from oral cancer in terms of treatment methods, disease progression, malignancy degree, and clinical prognosis. In view of the high incidence of tongue cancer metastasis, avoiding cancer metastasis to oropharyngeal cancer, which has higher mortality, is important [2,8]. Therefore, it is of great significance to detect the occurrence of OTSCC as early as possible to prevent the tumor from spreading to the tongue base and distant metastasis and to improve the diagnosis rate and survival rate of patients.
RIPOR3, RIPOR family member 3, is also known as FAM65C, which presents in 2 subtypes produced by alternative splicing [9]. Previous studies indicated that RIPOR3 was involved in molecular alterations in HER2-positive and HER2-negative gastric cancers, including the somatic single nucleotide variant and somatic structural variation [10]. As a gain gene with high, frequent copy number variations (CNV), it is easier to detect in HER2+ samples, indicating that it promotes the progression of gastric cancer. Some studies have shown that as an age-related DNA methylation marker, RIPOR3 is in a gradual state of hypomethylation with aging. These findings suggest RIPOR3 may play an important role in various age-related diseases and cancer [11]. However, the relationship between RIPOR3 and clinical features of tongue cancer has not been studied.
Thus, we sought to comprehensively evaluate the influence of RIPOR3 expression on the prognosis of tongue cancer and explore the possible mechanism of this gene based on the data collected from The Cancer Genome Atlas (TCGA). Furthermore, we preliminarily explored the correlation of RIPOR3 with genetic and epigenetic mechanisms, including methylation level and CNVs. Finally, the Human Protein Atlas (HPA) database and GSE31056 dataset were used for further external validation.
Material and Methods
ANALYSIS DATA ACQUISITION AND BIOINFORMATICS ANALYSIS:
The gene expression profiles and clinical data (workflow type: HTSeq FPKM) were downloaded from the TCGA (
SURVIVAL ANALYSIS AND COX ANALYSIS:
All statistical analyses were performed using R (v.3.6.3). The Wilcoxon rank-sum test and logistic regression were used to analyze the relationship between RIPOR3 and clinicopathological characteristics (age, sex, grade, stage, tumor size, regional lymph nodes, surgery treatment, and radiation therapy). Cox regression and the Kaplan-Meier method were used to analyze the relationship between overall survival (OS), progression-free interval (PFI), disease-specific survival (DSS), and the clinical features of patients with tongue cancer.
GENE SET ENRICHMENT ANALYSIS:
Gene set enrichment analysis (GSEA) is a computational method that identifies whether a priori defined sets of genes show statistically concordant differences between 2 biological functions or phenotypes [12]. In our study, GSEA firstly generated an ordered list on the classification of all genes according to their correlation with RIPOR3 expression. GSEA was applied to calculate the statistically significant survival difference observed between RIPOR3 high- and low-expression groups. Gene sets with a false discovery rate (FDR) q-value <0.05 were considered to be significantly enriched [13].
IMMUNE SCORES AND STROMAL SCORES WITH RIPOR3 EXPRESSION:
The Estimation of Stromal and Immune cells in Malignant Tumor tissues using Expression data (ESTIMATE) algorithm was used to calculate the immune and stromal scores [14]. ESTIMATE can predict tumor purity by calculating immune and stromal scores, thereby predicting the content of stromal cells and immune cells. Using the R packages “ggplot2”, “ggpubr”, and “ggExtra” and the Spearman method, we quantified the association of RIPOR3 expression with immune scores and stromal scores.
CORRELATION ANALYSIS OF RIPOR3 EXPRESSION WITH THE IMMUNE RESPONSE OF 22 TUMOR-INFILTRATING IMMUNE CELLS:
We analyzed the immune response of 22 tumor-infiltrating immune cells (TIICs) in OTSCC via the CIBERSORT algorithm (http://cibersort.stanford.edu/), with the algorithm running with its default signature matrix at 1000 permutations [15]. In addition to analyzing the general analysis of immune cell type, we analyzed the correlation between RIPOR3 expression and several immune cell markers to identify the potential subtypes of infiltrating immune cells. The Spearman method was used to determine the correlation coefficient.
CBIOPORTAL:
The cBioPortal (www.cbioportal.org/) is a comprehensive web resource that can visualize and analyze multidimensional cancer genomics data [16,17]. Based on the TCGA database, the CNVs, co-expression, and methylation data of the RIPOR3 gene were obtained from cBioPortal. When performing epigenetic analysis, we only performed statistical analysis of 127 tumor samples, and excluded 13 normal samples included in the 140 samples. The threshold of the z score of mRNA expression (RNA Seq V2 RSEM) was ±2.0.
VALIDATION OF THE HPA AND GENE EXPRESSION OMNIBUS DATABASES:
The HPA database (
Results
TUMORIGENIC EFFECT AND PROGNOSIS VALUE OF RIPOR3 LOW EXPRESSION:
We obtained the data of TCGA, processed the expression data of mRNA, and found that the transcripts of RIPOR3 in OTSCC tumor tissue were significantly higher than that in normal tissue (P=3.396E-06) (Figure 1A). The trend of gene overexpression was also observed in OTSCC paired samples (P=0.002) (Figure 1B) by the Wilcoxon rank-sum test.
SURVIVAL OUTCOMES AND PROGNOSTIC VALUE OF RIPOR3:
All tongue cancer patients were divided into 2 groups based on the median expression value of RIPOR3: a high-expression group and a low-expression group. Kaplan-Meier survival analysis showed the high-expression group in OTSCC had a significantly positive correlation with OS, PFI, and DSS (Figure 1C–1E). The univariate analysis revealed that low RIPOR3 expression was significantly correlated with poor OS (hazard ratio [HR] 0.256, 95% confidence interval [CI] 0.109–0.643, P=0.003; Table 1). By multivariate analysis, RIPOR3 remained independently associated with OS, with an HR of 0.276 (P=0.007), along with advanced grade and tumor size, regional lymph node, surgery treatment, and radiation therapy (Figure 2D).
CLINICAL CHARACTERISTICS AND MULTIVARIATE ANALYSIS WITH RIPOR3 EXPRESSION:
Subsequently, we examined the correlation between gene and clinicopathological features, and the results showed that the expression of RIPOR3 was significantly correlated with tumor stage (P=0.029), tumor size (P=0.005), and tumor histological grade (P=0.022) (Figure 2A–2C). As shown in Table 1, univariate Cox regression analysis showed that grade, tumor size, regional lymph nodes, surgery treatment, and radiation therapy were significantly correlated with the rate of OS. In multivariate analysis, RIPOR3 expression was an independent prognostic factor (Figure 2D).
GSEA ANALYSIS OF RIPOR3-RELATED SIGNALING PATHWAY:
To identify signaling pathways that were differentially activated in OTSCC, we conducted GSEA between RIPOR3 datasets with low and high expression. We selected the most significantly enriched signaling pathways based on their FDR q-val in the high-expression samples, but no significant pathway was found in the low-expression group. As shown in Figure 3A–3I, the B-cell receptor signaling pathway, T-cell receptor signaling pathway, natural killer cell-mediated cytotoxicity, pathway in cancer, primary immunodeficiency, TGF-β signaling pathway, Toll-like receptor pathway, JAK-STAT signaling pathway, and MAPK signaling pathway were differentially enriched in the RIPOR3 high-expression phenotype.
ASSOCIATION WITH THE EXPRESSION OF RIPOR3 AND TUMOR MICROENVIRONMENT:
From the results of GSEA, it was seen that the RIPOR3 gene was significantly enriched in the immune-related signaling pathway; therefore, we divided the tumor samples into high- and low-expression groups based on the median value of RIPOR3 expression and further evaluated the relationship between the RIPOR3 and tumor microenvironment by quantifying the tumor stromal cell score, immune cell score, and RIPOR3 expression level. More interestingly, as shown in Figure 4C and 4D, the scores of stromal cells and immune cells were positively correlated with the expression of RIPOR3 in the tumor groups (R=0.62, P<2.2e-16; R=0.47, P=4.7e-08), which indirectly indicated that the gene was related to the tumor microenvironment and immune activity.
TIICS AND RIPOR3 EXPRESSION:
To further confirm the correlation of RIPOR3 expression with the immune microenvironment, we analyzed the content difference of 22 TIICs in the 2 groups with the CIBERSORT algorithm. The results showed that the fraction of naive B cells and resting mast cells increased significantly in the high-expression group (Figure 4A), which was similar and complementary to the GSEA function analysis results. Figure 4B shows the barplot of the proportion of the 22 TIICs in each sample of the high-expression group and low-expression group. The correlation heatmap of immune cells in patients with OTSCC, as shown in Figure 5A and 5B, provided us with the interaction between the expression of different immune cells. It can be seen that there were significant positive and negative correlations between a variety of immune cells, such as CD8 T cells with activated memory T cells, activated dendritic cells with monocytes, and CD8 T cells with macrophages M0 (Figure 5B). In addition, we determined that naive B cells (R=0.29, P=0.00085) and resting mast cells (R=0.2, P=0.025) were significantly positively correlated with RIPOR3 expression and activated mast cells (R=−0.17, P=0.058) and follicular helper T cells (R=0.16, P=0.079) showed certain correlations (Figure 5C–5F). These results further supported that the levels of RIPOR3 affected the immune-dominant status for the tumor microenvironment.
RELATIONSHIP BETWEEN IMMUNE CELLS AND CLINICAL FEATURES:
Based on the above confirmed correlation between RIPOR3 expression and tumor microenvironment and immune cell infiltration, we further confirmed, by analyzing the relationship between immune cells and clinicopathological characteristics, that immune cells infected by RIPOR3 did participate in and played a certain role in the occurrence and development of OTSCC. Resting CD4 memory T cells and lymph node status (P=0.0019), regulatory T cells (Tregs) and tumor size (P=0.025), and resting dendritic cells and tumor size (P=0.0017) were significantly correlated (Figure 6A–6C).
NEIGHBOR GENES, CNVS, METHYLATION, AND INTERACTION ANALYSES OF RIPOR3 IN PATIENTS WITH OTSCC:
The most frequently altered neighbor genes (FDR q-value<0.05) associated with RIPOR3 expression were isolated with cBioPortal. Enrichment analysis of these related genes showed that multiple functional enrichment was significantly enriched in immune-related pathways, such as Th1 and Th2 cell differentiation, Th17 cell differentiation, B-cell receptor signaling pathway, and T-cell receptor signaling pathway. The methylation and CNV analysis data of 127 tumor samples of OTSCC were also obtained from cBioPortal. As shown in Figure 7, Spearman and Pearson analyses both showed that the mRNA level of RIPOR3 was significantly negatively correlated with the degree of methylation, and RIPOR3 expression in the hypermethylation group was lower (Figure 7B). However, no correlation between the change of copy number type and gene expression was found (Figure 7A).
VALIDATION OF THE HPA AND GSE31056 DATABASES:
We evaluated the expression of RIPOR3 protein in 20 cancer tissues from the HPA database and found that most cancer tissues displayed weak to moderate nuclear and occasional cytoplasmic positivity, and a relatively higher protein expression ratio in head and neck cancer and thyroid cancer (Figure 8A). As shown in Figure 8C and 8D, negative and moderate RIPOR3 staining were observed in the normal tongue tissue, while low (stage II, T2) or moderate (stage III, T3) protein expression was reflected in tumor tissues (Figure 8E, 8F). We used the GSE31056 dataset as an external cohort to identify the differential expression level of RIPOR3 in tumor and normal tissues (Figure 8B). The results were consistent with the conclusions of the TCGA cohort analysis, showing significantly higher expression in tumor than in normal tissues (P=0.005).
Discussion
RIPOR3, RIPOR family member 3, is located on chromosome 20 [18], with broad expression in the bone marrow, kidney, and 22 other tissues. Protein FAM65C, a member of the extracellular region, regulates cellular processes in response to stimuli [19]. At present, the reports in the literature on the RIPOR3 gene are limited. Recently, Zhou analyzed the lncRNA-miRNA-mRNA ceRNA network in squamous cell carcinoma of the tongue and found some mRNA, lncRNA, and miRNA are significantly related to survival, including RIPOR3; this was one of the few reports on the relationship between this gene and tongue cancer [20]. In view of the high incidence of tongue cancer, differential tumor prognosis in the anterior tongue (mobile body of the tongue) and base of the tongue, and the effect on the quality of life of patients, we systematically conducted the first-ever analysis of the role of RIPOR3 in tongue cancer, especially OTSCC, in the present study.
We found that the RIPOR3 expression in samples from patients with OTSCC was significantly higher than that in normal samples and also showed statistically significant differences in matched samples, as verified in the GEO and HPA databases. It was identified that an increased RIPOR3 expression contributed to favorable OS; the PFS also showed a higher proportion of survival in the high-expression group with the same time from randomization to tumor progression. Similarly, DSS reflected that patients who died of OTSCC had a shorter survival time in the low-expression group. Multivariate analysis also showed that high RIPOR3 expression was an independent predictive factor associated with favorable OS in cohorts. In addition, low expression of RIPOR3 in OTSCC was positively related with advanced tumor stage and regional lymph nodes but negatively correlated with tumor grade, which could be seen from hazard ratio confidence intervals, indicating that different clinical traits had multiple adaptive reactions to RIPOR3. GSEA analysis showed that B-cell and T-cell receptor signaling pathways, natural killer cell-mediated cytotoxicity, pathway in cancer, and primary immunodeficiency in KEGG were enriched in the high RIPOR3 expression phenotype pathway, which suggested that this gene might be related to the immune-related regulatory pathway. Since the research on the function of the RIPOR3 gene was quite limited, we evaluated 2 other members of the RIPOR3 family, FAM65A and FAM65B. Megrelis et al found that the expression and phosphorylation of FAM65B can well regulate the number of active RhoA, which was conducive to the best movement of T lymphocytes and enhanced immune function [21]. Froehlich et al proved that FAM65B was related to T-cell migration and proliferation [22]. FAM65A played a role in regulating Golgi reorientation during cell migration [23]. Relevant literature showed that immune cells were an important part of tumor tissue, and the infiltration of immune cells varied greatly among different tumor types and histological subtypes [24]. Therefore, based on the immune pathway enriched by GSEA and the role of FAM65 family members in cell migration and immunity, we speculated that the relatively longer survival of tumor patients with high expression of RIPOR3 was due to the fact that immune cells play a certain role, thus affecting the progression of the disease.
Another study showed strongly associated gene expression in different immune cells [25]. We analyzed the relationship between the RIPOR3 gene in the tumor microenvironment and immune cell infiltration and found that diverse immune marker sets and immune infiltration levels in OTSCC were correlated with high RIPOR3 expression and the contents of naive B cells and resting mast cells were significantly increased in patients with upregulated expression. In addition, the correlation heatmap showed some strong correlations between immune cells, and we found that certain immune cells were significantly associated with clinical traits; for instance, different T-cell subtypes were remarkably correlated with tumor size, regional lymph nodes, and tumor stage. A strong correlation between the expression of immune signals in different types of immune cells showed diverse but quite predictable and consistent tumor immune infiltration [26]. Finally, function enrichment analysis of differentially expressed neighbor genes related to RIPOR3 showed that multiple immune pathways played a certain role in tumor progression.
Genetic and epigenetic mechanisms play an important role in the process of tumorigenesis [27]. Genetic mechanisms mainly include aberrant gene expression. Epigenetic mechanisms include methylation modification and post-transcriptional regulation [28]. Gene methylation will block the initiation of transcription and prevent the transcription process, which is characterized by hypomethylation that activates gene transcription [29], while hypermethylation hinders gene transcription and leads to gene silencing [30]. Therefore, we preliminarily studied the possible mechanism of RIPOR3 expression from the CNV and methylation level of the gene. Different types of CNVs had no significant effect on gene expression, but DNA methylation was significantly negatively correlated with the expression of RIPOR3. The hypermethylation level inhibited the transcription of mRNA and reduced RIPOR3 expression. We speculated that the downregulated expression of RIPOR3 in OTSCC patients with poor prognosis was partly due to hypermethylation modification. Through the HPA and GEO databases, it was confirmed that the gene had higher expression in tumor tissues and increased RIPOR3 contributed to favorable OS.
Therefore, we suggested that RIPOR3 may have a potential effect on tumor immunology. When the carcinogenic factors appear, the gene will be differentially expressed in patients, affecting and regulating immune-related pathways, thus playing an anti-tumor role. Therefore, based on the above results, the RIPOR3 gene may be a favorable gene that affects and regulates varieties of immune cells and is a promising tumor biomarker.
Our research had some limitations, such as a small sample size, incomplete clinical data, and lack of some etiology. Therefore, the molecular mechanisms involved may be the focus of our future work.
Conclusions
Taken together, our study results suggested that RIPOR3 might serve as a promising prognostic biomarker and is correlated with immune cell infiltration and DNA methylation. These results may provide new insights for the prognosis and immunotherapy of tongue cancer.
Figures
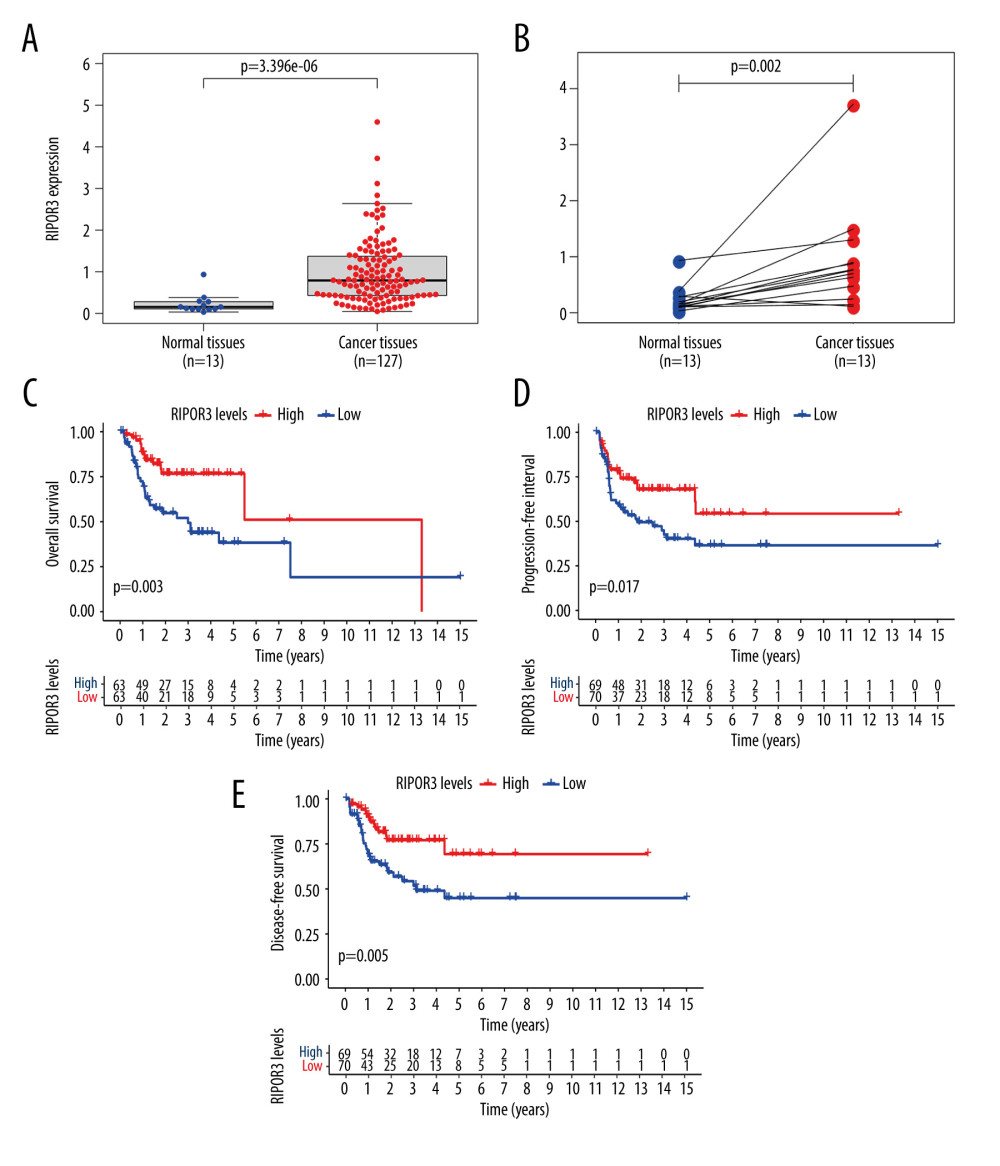 Figure 1. The differentiated expression of RIPOR3 and correlation with survival outcomes. (A) Differentiated expression of RIPOR3 in normal tongue tissue (n=13) and oral squamous cell carcinoma of the mobile tongue (OTSCC) (n=127) in the The Cancer Genome Atlas cohort (P<0.0001). (B) Paired heterogeneous analysis of RIPOR3 expression in normal and tumor samples derived from the same patient (P=0.002 by the Wilcoxon rank-sum test). (C–E) Kaplan-Meier survival analysis of the relationship between RIPOR3 mRNA expression and overall survival (P=0.003), progression-free interval (P=0.017) and disease-specific survival (P=0.005) in OTSCC cases.
 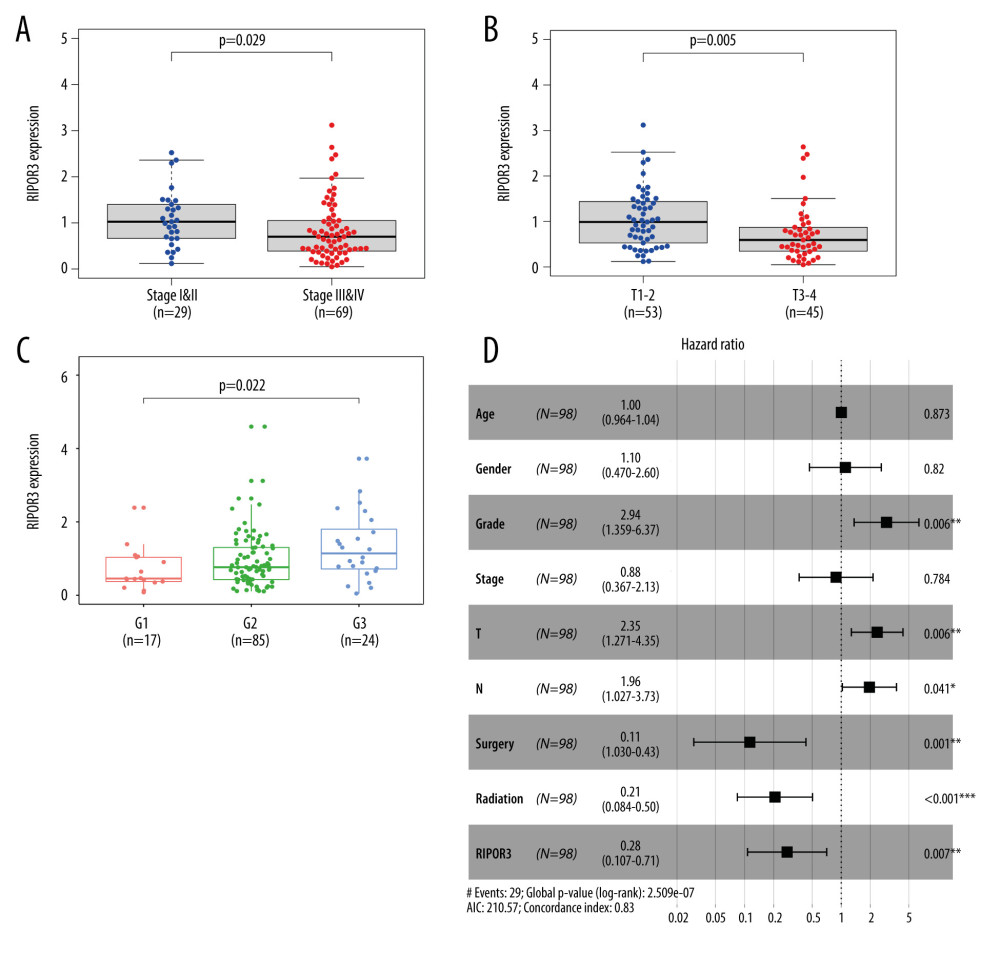 Figure 2. Correlations between RIPOR3 mRNA levels with oral squamous cell carcinoma of the mobile tongue (OTSCC) clinical characteristic in the The Cancer Genome Atlas cohort. (A) Stage (stage I&II, n=29; stage III&IV, n=69). (B) Tumor size (T1–2, n=53; T3–4, n=45). (C) Grade (G1, n=17; G2, n=85; G3, n=24). (D) Multivariate Cox analysis of RIPOR3 expression and clinical characteristics in OTSCC (n=98). (* P<0.05, ** P<0.01, *** P<0.001).
 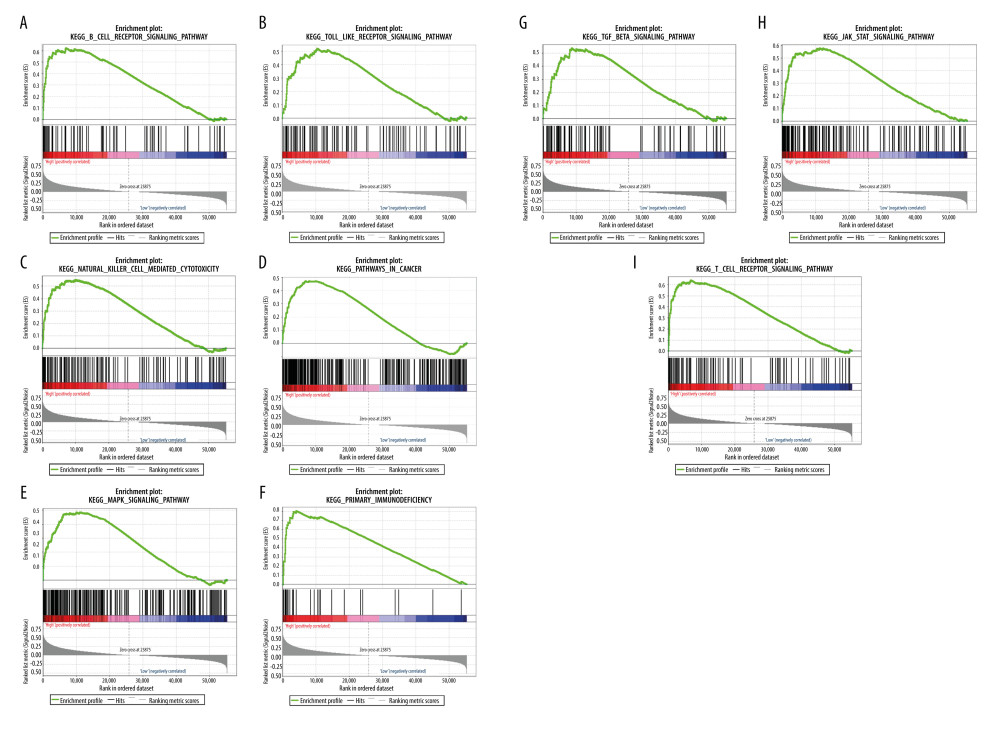 Figure 3. (A–I) Gene Set Enrichment Analysis. Each line represents 1 particular gene set and high-expression genes are in the left, approaching the origin of the coordinates; by contrast, the low-regulated are on the right of the X-axis. Only gene sets with NOM P<0.05 and false discovery rate (FDR) q<0.05 were considered significant. Genes associated with a high-risk phenotype were significantly enriched with the immune-related pathway.
 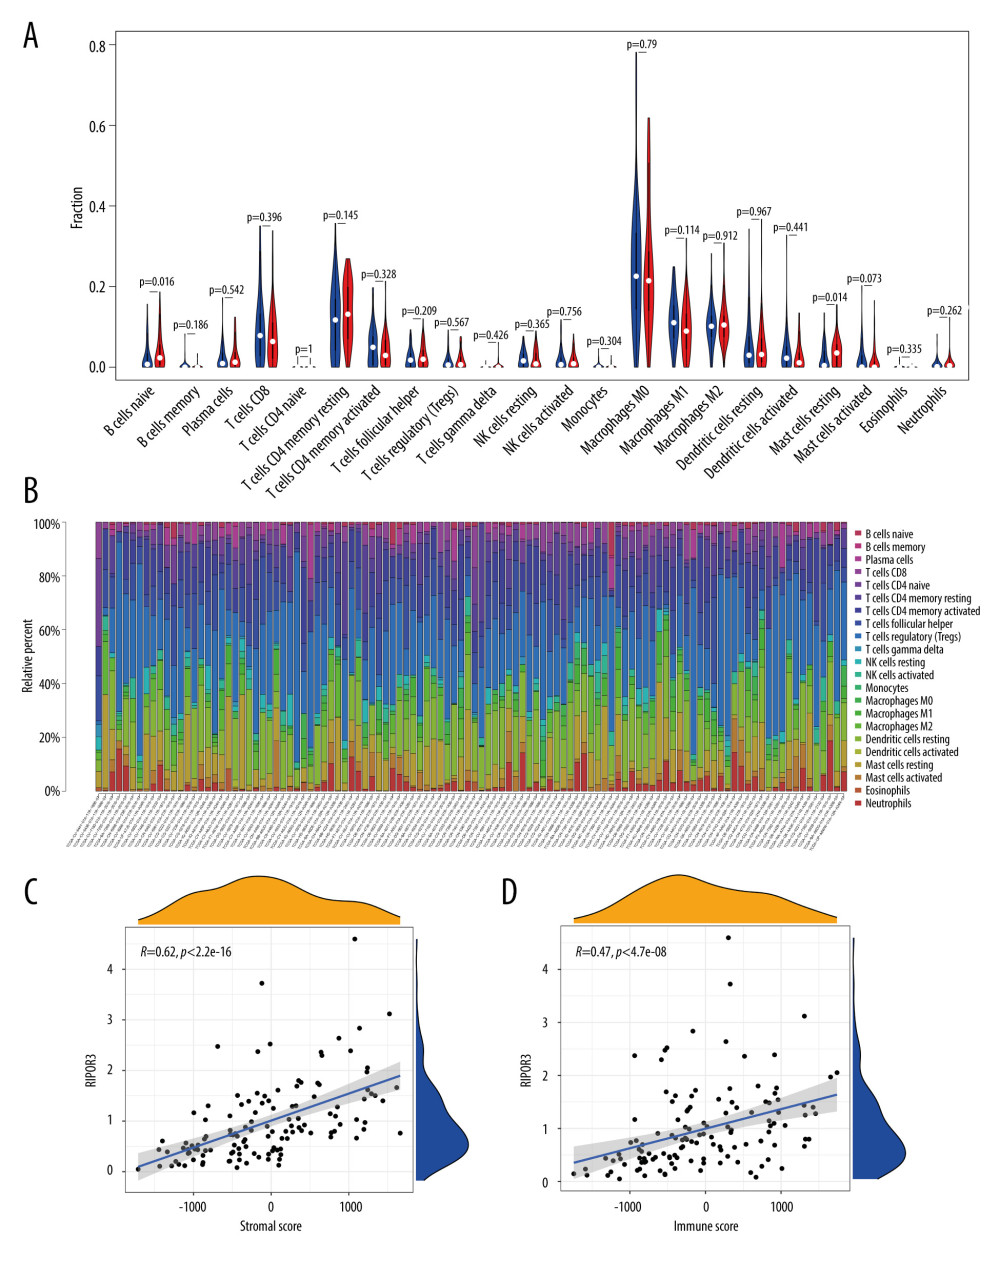 Figure 4. Correlation of RIPOR3 with tumor-infiltrating immune cells (TIICs). (A) Violin plot showing the ratio differentiation of 22 kinds of immune cells between oral squamous cell carcinoma of the mobile tongue (OTSCC) samples (n=110), which was filtered by the CIBERSOR algorithm with P<0.05, with low or high RIPOR3 expression relative to the median of the RIPOR3 expression level. (B) Barplot showing the proportion of 22 kinds of TIICs in OTSCC tumor samples. Column names of the plot were sample ID. (C, D) Scatter plot showing the correlation of the stromal cell score and immune cell score with RIPOR3 expression (P< 0.05). (* P<0.05, ** P<0.01, *** P<0.001).
 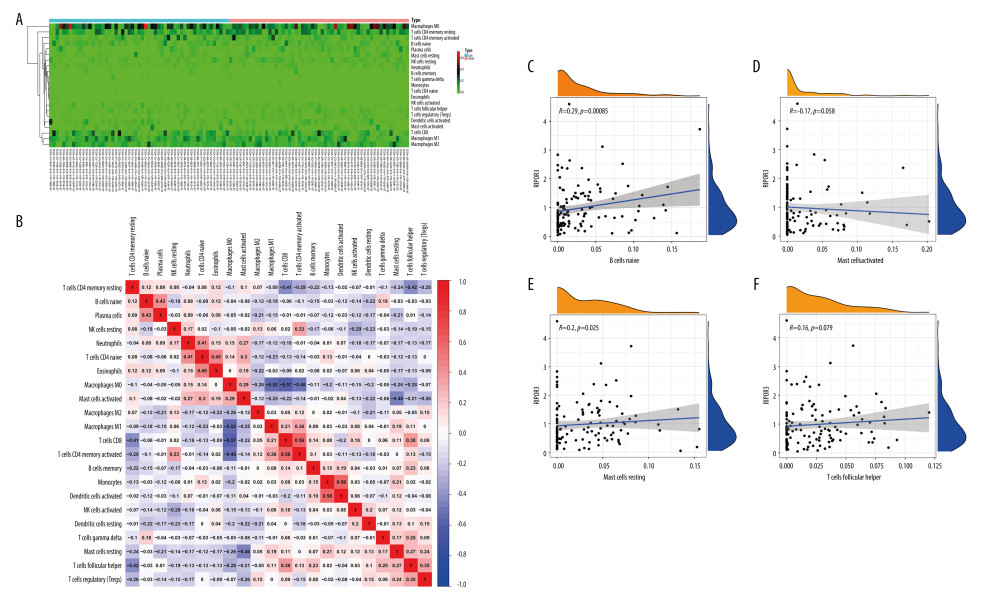 Figure 5. Immune cell infiltration patterns and correlation of high and low RIPOR3 expression groups with differential immune cells. (A) Heatmap of tumor-infiltrating immune cells (TIICs) in low-expression (n=55) and high-expression groups (n=55). (B) Heatmap showing the correlation between 22 TIICs and numeric value in each tiny box indicating the P value of correlation between the 2 kinds of cells. The shade of each tiny color box represents corresponding correlation value between 2 cells, and Pearson coefficient was used for significance test. (C–F) Scatter plot showing the correlation of TIIC proportion with RIPOR3 expression. (* P<0.05, ** P<0.01, *** P<0.001).
 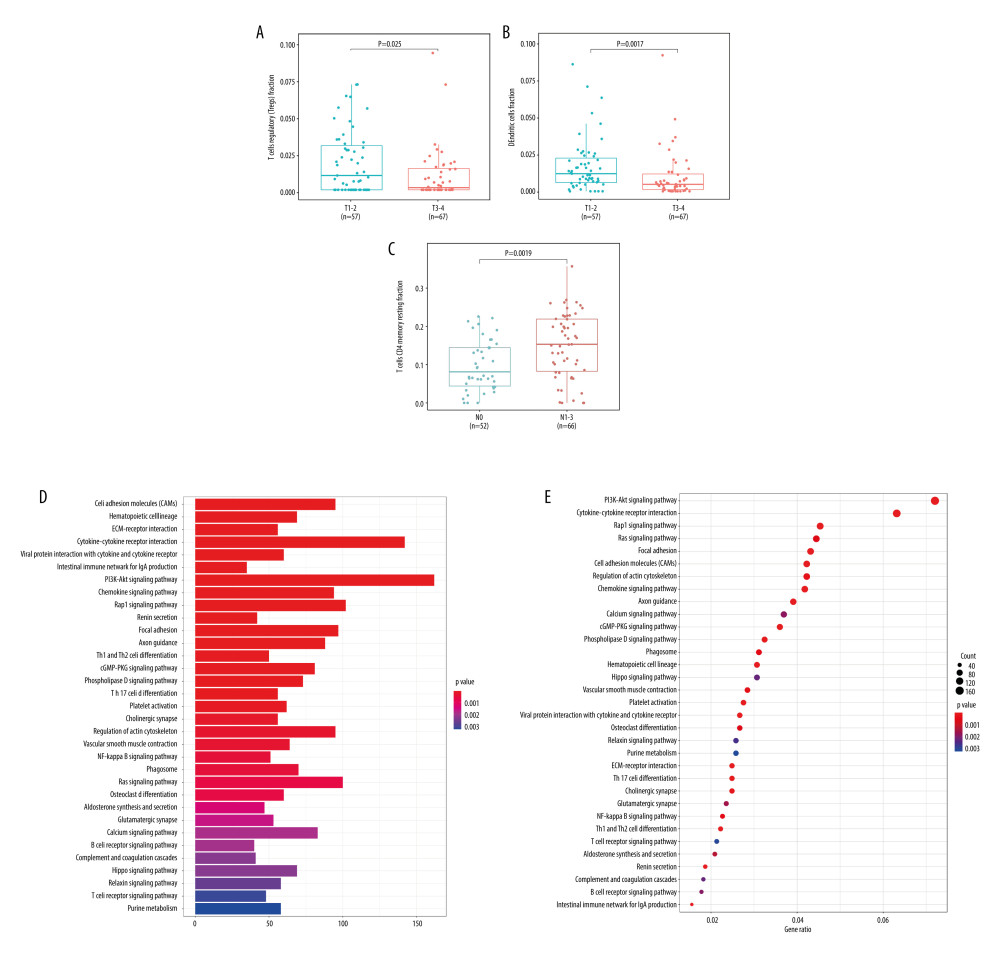 Figure 6. Correlations between immune cells level and clinicopathological parameters of oral squamous cell carcinoma of the mobile tongue (OTSCC) patients. (A, B) Differential expression of T regs and dendritic cells resting fraction were significantly negatively related to tumor size (P=0.025, P=0.002; T1–2, n=57, T3–4, n=67), while (C) CD4 memory resting T cells were significantly positively correlated with lymph node size (P=0.002, N0=52, N1–3=66). (D) The barplot of KEGG enrichment analysis of most frequently altered neighbor genes in OTSCC with RIPOR3. (E) The dotplot of KEGG enrichment analysis of most frequently altered neighbor genes in OTSCC with RIPOR3. (* P<0.05, ** P<0.01, *** P<0.001).
 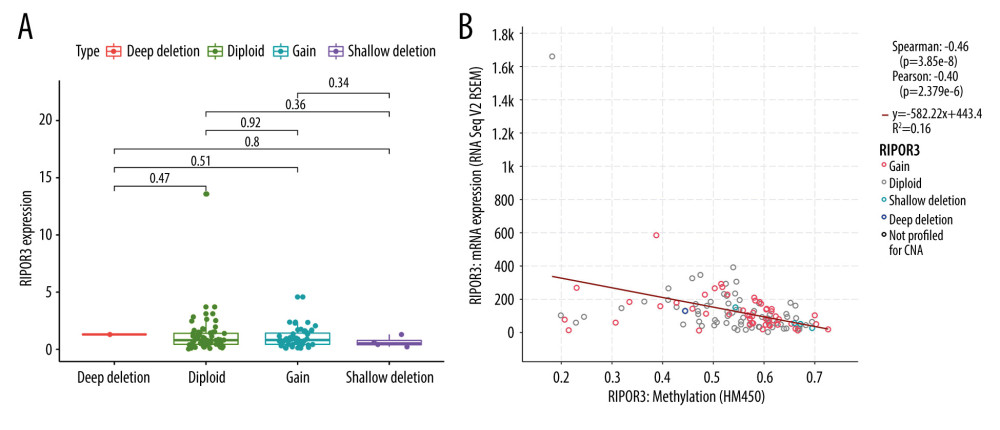 Figure 7. Correlation of RIPOR3 expression levels with genetic and epigenetic mechanisms. (A) Copy number variation. (B) Methylation level. The red line in the plot was fitted with a linear model indicating the proportion of tropism of the methylation level along with RIPOR3 expression, and the Spearman coefficient was used for the correlation test. (* P<0.05, ** P<0.01, *** P<0.001).
 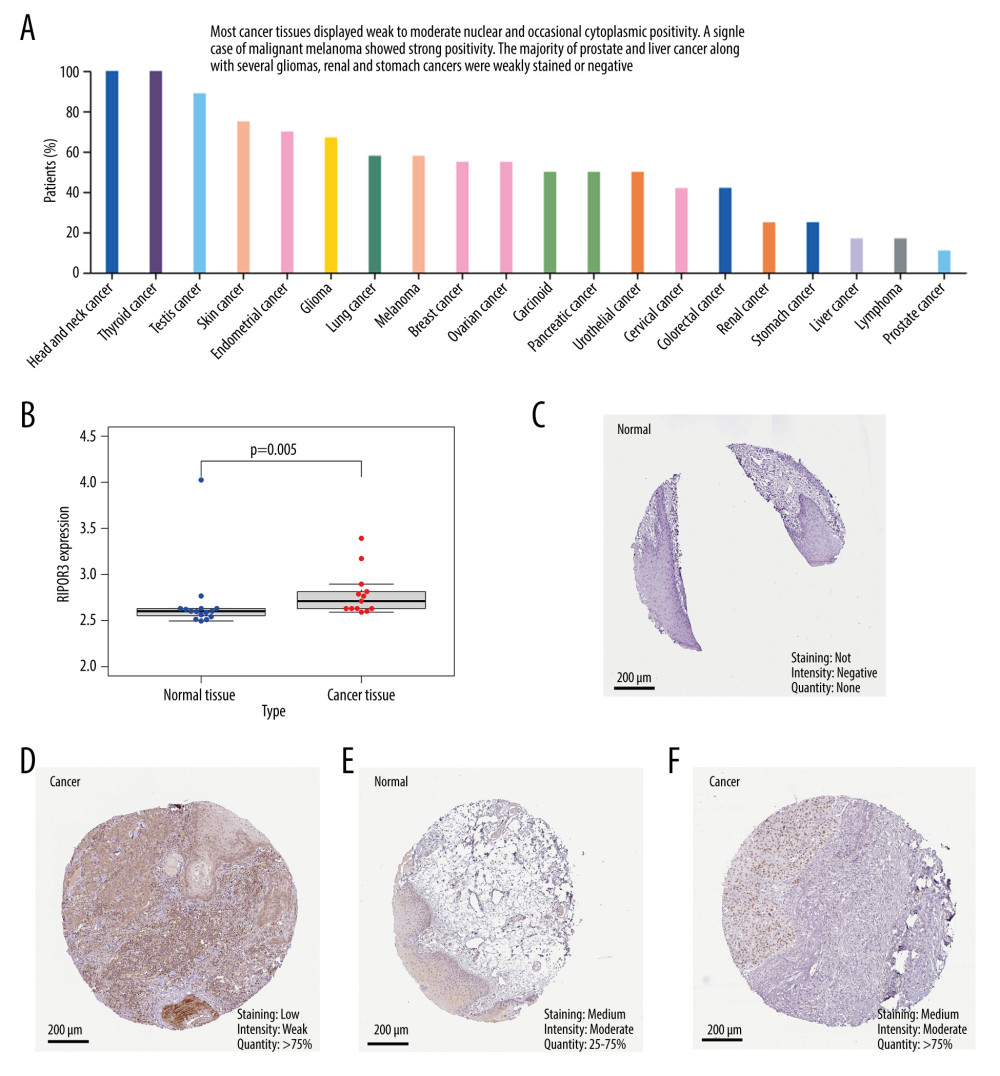 Figure 8. Immunohistochemical analysis of RIPOR3 protein expression in 20 major malignant tumors and expression levels in normal and oral squamous cell carcinoma of the mobile tongue (OTSCC) patients. (A) Changes of protein expression in different malignant tumors. (B) Difference in RIPOR3 expression between normal tongue tissues and OTSCC patients from GSE31056 dataset. (C) Negative RIPOR3 expression in normal tongue tissue. (D) Low protein expression in cancer tissues (stage II, T2). (E) Moderate RIPOR3 expression in normal tongue tissue. (F) Moderate RIPOR3 expression in OTSCC tissue (stage III,T3).
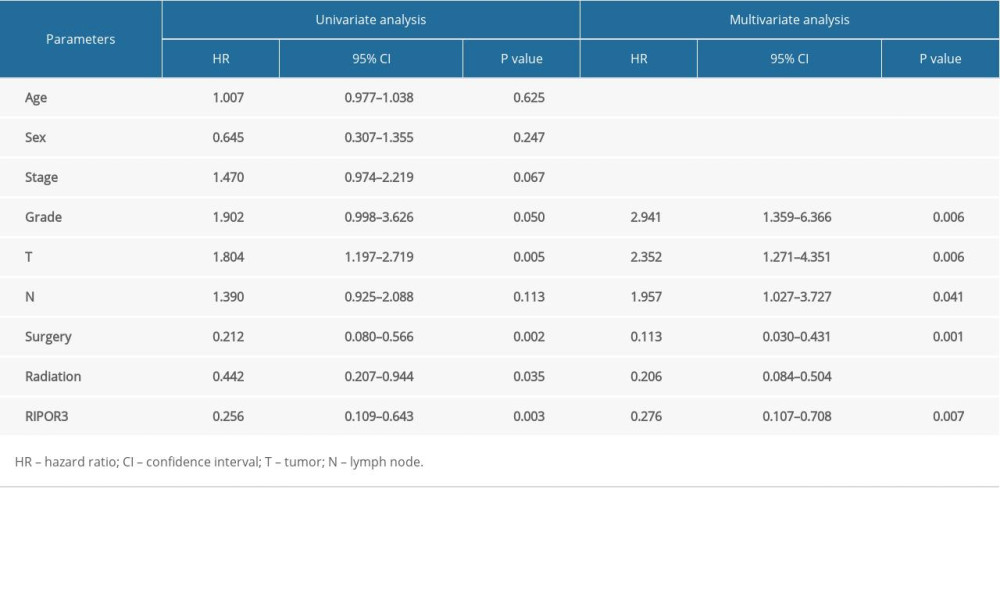
References
1. Carlisle JW, Steuer CE, Owonikoko TK, An update on the immune landscape in lung and head and neck cancers: Cancer J Clin, 2020; 70; 505-17
2. Bray F, Ferlay J, Soerjomataram I, Global cancer statistics 2018: GLOBOCAN estimates of incidence and mortality worldwide for 36 cancers in 185 countries: Cancer J Clin, 2018; 68; 394-424
3. da Silva Souto AC, Vieira Heimlich F, Lima de Oliveira L, Epidemiology of tongue squamous cell carcinoma: A retrospective cohort study: Oral Dis, 2021 [Online ahead of print]
4. Taneja N, Alam A, Patnaik RS, Understanding nanotechnology in the treatment of oral cancer: A comprehensive review: Crit Rev Ther Drug Carrier Syst, 2021; 38; 1-48
5. Farid H, Khan M, Jamal S, Oral manifestations of COVID-19-A literature review: Rev Med Virol, 2021 [Online ahead of print]
6. Balasubramanian D, Subramaniam N, Missale F: Head Neck, 2021; 43; 1043-55
7. Miller C, Shay A, Tajudeen B, Clinical features and outcomes in young adults with oral tongue cancer: Am J Otolaryngol, 2019; 40; 93-96
8. Cohen Goldemberg D, de Araújo LHL, Antunes HS, Tongue cancer epidemiology in Brazil: Incidence, morbidity and mortality: Head Neck, 2018; 40; 1834-44
9. Yamaguchi T, Hosomichi K, Yano K, Comprehensive genetic exploration of selective tooth agenesis of mandibular incisors by exome sequencing: Hum Genome Var, 2017; 4; 17005
10. Zhou C, Feng X, Yuan F, Difference of molecular alterations in HER2-positive and HER2-negative gastric cancers by whole-genome sequencing analysis: Cancer Manag Res, 2018; 10; 3945-54
11. Alsaleh H, Haddrill PR: Forensic Sci Int, 2019; 303; 109944
12. Zito A, Lualdi M, Granata P, Gene set enrichment analysis of interaction networks weighted by node centrality: Front Genet, 2021; 12; 577623
13. Li J, Ye M, Zhou C, Expression profile and prognostic values of HOXA family members in laryngeal squamous cell cancer: Front Oncol, 2020; 10; 368
14. Reichling C, Taieb J, Derangere V, Artificial intelligence-guided tissue analysis combined with immune infiltrate assessment predicts stage III colon cancer outcomes in PETACC08 study: Gut, 2020; 69; 681-90
15. Nie RC, Yuan SQ, Wang Y, Robust immunoscore model to predict the response to anti-PD1 therapy in melanoma: Aging (Albany NY), 2019; 11; 11576-90
16. Buechner P, Hinderer M, Unberath P, Requirements analysis and specification for a molecular tumor board platform based on cBioPortal: Diagnostics (Basel), 2020; 10(93); 15
17. Ahluwalia P, Mondal AK, Bloomer C, Identification and clinical validation of a novel 4 gene-signature with prognostic utility in colorectal cancer: Int J Mol Sci, 2019; 20(15); 3818
18. Deloukas P, Matthews LH, Ashurst J, The DNA sequence and comparative analysis of human chromosome 20: Nature, 2001; 414; 865-71
19. Diaz-Horta O, Abad C, Cengiz FB, Ripor2 is involved in auditory hair cell stereociliary bundle structure and orientation: J Mol Med (Berl), 2018; 96; 1227-38
20. Zhou RS, Zhang EX, Sun QF, Integrated analysis of lncRNA-miRNA-mRNA ceRNA network in squamous cell carcinoma of tongue: BMC Cancer, 2019; 19; 779
21. Megrelis L, El Ghoul E, Moalli F, Fam65b phosphorylation relieves tonic RhoA inhibition during T cell migration: Front Immunol, 2018; 9; 2001
22. Zhou LY, Zhai M, Huang Y, The circular RNA ACR attenuates myocardial ischemia/reperfusion injury by suppressing autophagy via modulation of the Pink1/FAM65B pathway: Cell Death Differ, 2019; 26; 1299-315
23. Mardakheh FK, Self A, Marshall CJ, RHO binding to FAM65A regulates Golgi reorientation during cell migration: J Cell Sci, 2016; 129; 4466-79
24. DeBerardinis RJ, Tumor microenvironment, metabolism, and immunotherapy: N Engl J Med, 2020; 382; 869-71
25. Ghraichy M, Galson JD, Kelly DF, B-cell receptor repertoire sequencing in patients with primary immunodeficiency: A review: Immunology, 2018; 153; 145-60
26. Montfort A, Pearce O, Maniati E, A strong B-cell response is part of the immune landscape in human high-grade serous ovarian metastases: Clin Cancer Res, 2017; 23; 250-62
27. Syeda ZA, Langden SSS, Munkhzul C, Regulatory mechanism of microRNA expression in cancer: Int J Mol Sci, 2020; 21(5); 1723
28. Yépez VA, Mertes C, Müller MF, Detection of aberrant gene expression events in RNA sequencing data: Nat Protoc, 2021; 16; 1276-96
29. Mahmood N, Rabbani SA, Targeting DNA hypomethylation in malignancy by epigenetic therapies: Adv Exp Med Biol, 2019; 1164; 179-96
30. Hu YH, Ma S, Zhang XN, Hypermethylation of ADHFE1 promotes the proliferation of colorectal cancer cell via modulating cell cycle progression: Onco Targets Ther, 2019; 12; 8105-15
Figures
Figure 1. The differentiated expression of RIPOR3 and correlation with survival outcomes. (A) Differentiated expression of RIPOR3 in normal tongue tissue (n=13) and oral squamous cell carcinoma of the mobile tongue (OTSCC) (n=127) in the The Cancer Genome Atlas cohort (P<0.0001). (B) Paired heterogeneous analysis of RIPOR3 expression in normal and tumor samples derived from the same patient (P=0.002 by the Wilcoxon rank-sum test). (C–E) Kaplan-Meier survival analysis of the relationship between RIPOR3 mRNA expression and overall survival (P=0.003), progression-free interval (P=0.017) and disease-specific survival (P=0.005) in OTSCC cases.Figure 2. Correlations between RIPOR3 mRNA levels with oral squamous cell carcinoma of the mobile tongue (OTSCC) clinical characteristic in the The Cancer Genome Atlas cohort. (A) Stage (stage I&II, n=29; stage III&IV, n=69). (B) Tumor size (T1–2, n=53; T3–4, n=45). (C) Grade (G1, n=17; G2, n=85; G3, n=24). (D) Multivariate Cox analysis of RIPOR3 expression and clinical characteristics in OTSCC (n=98). (* P<0.05, ** P<0.01, *** P<0.001).Figure 3. (A–I) Gene Set Enrichment Analysis. Each line represents 1 particular gene set and high-expression genes are in the left, approaching the origin of the coordinates; by contrast, the low-regulated are on the right of the X-axis. Only gene sets with NOM P<0.05 and false discovery rate (FDR) q<0.05 were considered significant. Genes associated with a high-risk phenotype were significantly enriched with the immune-related pathway.Figure 4. Correlation of RIPOR3 with tumor-infiltrating immune cells (TIICs). (A) Violin plot showing the ratio differentiation of 22 kinds of immune cells between oral squamous cell carcinoma of the mobile tongue (OTSCC) samples (n=110), which was filtered by the CIBERSOR algorithm with P<0.05, with low or high RIPOR3 expression relative to the median of the RIPOR3 expression level. (B) Barplot showing the proportion of 22 kinds of TIICs in OTSCC tumor samples. Column names of the plot were sample ID. (C, D) Scatter plot showing the correlation of the stromal cell score and immune cell score with RIPOR3 expression (P< 0.05). (* P<0.05, ** P<0.01, *** P<0.001).Figure 5. Immune cell infiltration patterns and correlation of high and low RIPOR3 expression groups with differential immune cells. (A) Heatmap of tumor-infiltrating immune cells (TIICs) in low-expression (n=55) and high-expression groups (n=55). (B) Heatmap showing the correlation between 22 TIICs and numeric value in each tiny box indicating the P value of correlation between the 2 kinds of cells. The shade of each tiny color box represents corresponding correlation value between 2 cells, and Pearson coefficient was used for significance test. (C–F) Scatter plot showing the correlation of TIIC proportion with RIPOR3 expression. (* P<0.05, ** P<0.01, *** P<0.001).Figure 6. Correlations between immune cells level and clinicopathological parameters of oral squamous cell carcinoma of the mobile tongue (OTSCC) patients. (A, B) Differential expression of T regs and dendritic cells resting fraction were significantly negatively related to tumor size (P=0.025, P=0.002; T1–2, n=57, T3–4, n=67), while (C) CD4 memory resting T cells were significantly positively correlated with lymph node size (P=0.002, N0=52, N1–3=66). (D) The barplot of KEGG enrichment analysis of most frequently altered neighbor genes in OTSCC with RIPOR3. (E) The dotplot of KEGG enrichment analysis of most frequently altered neighbor genes in OTSCC with RIPOR3. (* P<0.05, ** P<0.01, *** P<0.001).Figure 7. Correlation of RIPOR3 expression levels with genetic and epigenetic mechanisms. (A) Copy number variation. (B) Methylation level. The red line in the plot was fitted with a linear model indicating the proportion of tropism of the methylation level along with RIPOR3 expression, and the Spearman coefficient was used for the correlation test. (* P<0.05, ** P<0.01, *** P<0.001).Figure 8. Immunohistochemical analysis of RIPOR3 protein expression in 20 major malignant tumors and expression levels in normal and oral squamous cell carcinoma of the mobile tongue (OTSCC) patients. (A) Changes of protein expression in different malignant tumors. (B) Difference in RIPOR3 expression between normal tongue tissues and OTSCC patients from GSE31056 dataset. (C) Negative RIPOR3 expression in normal tongue tissue. (D) Low protein expression in cancer tissues (stage II, T2). (E) Moderate RIPOR3 expression in normal tongue tissue. (F) Moderate RIPOR3 expression in OTSCC tissue (stage III,T3). In Press
06 Mar 2024 : Clinical Research
Comparison of Outcomes between Single-Level and Double-Level Corpectomy in Thoracolumbar Reconstruction: A ...Med Sci Monit In Press; DOI: 10.12659/MSM.943797
21 Mar 2024 : Meta-Analysis
Economic Evaluation of COVID-19 Screening Tests and Surveillance Strategies in Low-Income, Middle-Income, a...Med Sci Monit In Press; DOI: 10.12659/MSM.943863
10 Apr 2024 : Clinical Research
Predicting Acute Cardiovascular Complications in COVID-19: Insights from a Specialized Cardiac Referral Dep...Med Sci Monit In Press; DOI: 10.12659/MSM.942612
06 Mar 2024 : Clinical Research
Enhanced Surgical Outcomes of Popliteal Cyst Excision: A Retrospective Study Comparing Arthroscopic Debride...Med Sci Monit In Press; DOI: 10.12659/MSM.941102
Most Viewed Current Articles
17 Jan 2024 : Review article
Vaccination Guidelines for Pregnant Women: Addressing COVID-19 and the Omicron VariantDOI :10.12659/MSM.942799
Med Sci Monit 2024; 30:e942799
14 Dec 2022 : Clinical Research
Prevalence and Variability of Allergen-Specific Immunoglobulin E in Patients with Elevated Tryptase LevelsDOI :10.12659/MSM.937990
Med Sci Monit 2022; 28:e937990
16 May 2023 : Clinical Research
Electrophysiological Testing for an Auditory Processing Disorder and Reading Performance in 54 School Stude...DOI :10.12659/MSM.940387
Med Sci Monit 2023; 29:e940387
01 Jan 2022 : Editorial
Editorial: Current Status of Oral Antiviral Drug Treatments for SARS-CoV-2 Infection in Non-Hospitalized Pa...DOI :10.12659/MSM.935952
Med Sci Monit 2022; 28:e935952