04 April 2022: Clinical Research
Combining Diffusion-Weighted Imaging and T2-Weighted Imaging to Delineate Tumorous Tissue in Peritoneal Carcinomatosis: A Comparative Study with 18F-Fluoro-Deoxyglucose Positron Emission Tomography with Computed Tomography (FDG PET/CT)
Qing Wu1ABC, Xiufang Xu1DEF*DOI: 10.12659/MSM.934664
Med Sci Monit 2022; 28:e934664


Abstract
BACKGROUND: The high rate of malignancy of peritoneal carcinomatosis makes its accurate detection vital in treatment planning. The combination of anatomical and functional information, provided by T2-weighted imaging (T2WI) and diffusion-weighted imaging (DWI), respectively, could potentially aid in the segmentation of tumors. The aim of this study was to compare the functional tumor volume estimated by a T2WI- and DWI-derived apparent diffusion coefficient (ADC) map, with metabolic tumor volume measured by 18F-fluoro-deoxyglucose positron emission tomography with computed tomography (FDG PET/CT).
MATERIAL AND METHODS: In 108 lesions from 108 patients with peritoneal carcinomatosis, gross tumor volume (GTV) was manually delineated on DWI. Within each region of interest, k-means clustering was used to exclude non-tumorous tissue from tumorous tissue. The high-cellularity tumor volume estimated from ADC (HCTVADC) and combined high-cellularity tumor volume (HCTVC), which was estimated by combining anatomical information from T2WI and functional information from ADC, were generated. Taking metabolic tumor volume (MTV) in PET/CT as a reference, GTV, HCTVADC, and HCTVC were compared with MTV.
RESULTS: GTV (P=0.017) and HCTVADC (P=0.048) differed significantly from MTV. However, the HCTVC measured by combining DWI and T2WI showed high concordance (ICC=0.99) with the MTV measured by FDG PET/CT in differentiating tumorous tissues with high cellularity from non-tumorous tissues.
CONCLUSIONS: In conclusion, our results suggested the potential value of this semiautomatic method serving as an alternative to PET/CT in radiotherapy tumor contouring.
Keywords: Diagnostic Imaging, Diffusion Magnetic Resonance Imaging, Peritoneal Neoplasms, Fluorodeoxyglucose F18, Humans, Positron Emission Tomography Computed Tomography, Positron-Emission Tomography, Radiopharmaceuticals
Background
The peritoneum, which is made up of the visceral and parietal peritoneum, is the serous membrane that forms the lining of the abdominal and pelvic cavities. Whereas metastatic disease is the most common malignant process involving the peritoneum, primary peritoneal carcinoma is rarely seen [1]. Usually originating from intra-abdominal primary neoplasms, including the stomach, colon, ovary, and pancreas, peritoneal carcinomatosis is extensive in nature and usually occurs in an advanced state of the disease when discovered, which makes patient prognosis very poor [2,3]. To ensure tumor-free survival, total peritonectomy combined with multivisceral resection of all involved viscera and additional hyperthermic intraperitoneal chemotherapy [4] has been a promising approach in recent years to achieve complete cytoreduction [5]. Considering that the meticulous preoperative assessment of the size and localization of tumor manifestations is mandatory [6], an accurately planned therapy could limit the spread of malignancies and improve patient outcomes while selectively sparing the adjacent organs. Therefore, there is an urgent need to find a new approach to improve the accuracy of tumor delineation.
Peritoneal carcinomatosis presents different patterns that depend on the primary tumor and result from different pathways implicated in tumor spread, such as direct invasion and lymphatic, hematogenous, and intraperitoneal seeding [7]. The diffuse extent and variety in patterns lower the sensitivity of conventional abdominal radiographs for detecting peritoneal carcinomatosis [8]. To provide anatomic and metabolic information, 18F-fluorodeoxyglucose positron emission tomography combined with computed tomography (FDG PET/CT) is a useful tool to assess peritoneal tumor spread. With the help of a parameter known as the “standard uptake value” (SUV) to differentiate benign and malignant tumors, PET/CT is still considered the mainstay method for tumor delineation and treatment monitoring [9,10]. However, drawbacks such as radiation exposure, high cost, and the limitation of the small volume of metabolically active tumors [11] are cause for researchers to find alternative imaging techniques that could serve the same purpose.
In recent years, the emergence of diffusion-weighted imaging (DWI) has enhanced tumor detection. While most solid tumors demonstrate restricted diffusion owing to their high cellularity, which results in the restriction of water movement and corresponding high signal intensity on DWI [12–14], the DWI-derived apparent diffusion coefficient (ADC) value shows a negative correlation with tissue cellularity. In most cases, the magnetic resonance (MR) findings of peritoneal carcinomatosis include masses with homogeneous signal intensity and omental caking associated with ascites [7,8,15]. Despite superior contrast of soft tissue, delineation of tumor extent can be limited using conventional T2-weighted imaging (T2WI). DWI provides better suppression of ascites and highlights tumorous tissues with restricted diffusion and could thus potentially increase tumor conspicuity [12]. A semiautomatic approach based on ADC maps and FDG PET/CT has been proposed, and its usefulness has been verified on segmenting lesions such as glioblastoma, which presents heterogeneous signal intensity in DWI [16]. To date, this method has not been applied to peritoneal carcinomatosis. Thus, the aim of this study was to compare the functional tumor volume estimated by T2WI- and DWI-derived ADC maps, with the metabolic tumor volume (MTV) measured by FDG PET/CT as the criterion standard.
Material and Methods
PARTICIPANTS:
The study was approved by the Institutional Review Board of Hangzhou Medical College. Written informed consent was obtained from all participants before the study. A total of 127 patients with proven or suspected peritoneal carcinomatosis were found in our department’s database. Before the surgical resection, all patients who underwent FDG PET/CT and MR imaging (MRI) from September 2015 to August 2019 were included. We included only those cases with complete coverage of the tumor on MRI. The time difference between MRI and FDG PET/CT was no more than 2 weeks. Patients who received treatment between 2 examinations were excluded to eliminate the influence of interventions.
PET/CT AND MTV DELINEATION:
Whole-body (coverage from the vertex to the feet) FDG PET/CT images were acquired using a combined PET/CT scanner (Discovery VCT; GE Healthcare Bio-Sciences Corp) with a standardized protocol. After 6 h of fasting, 250 to 400 Mbq (4.8 MBq/kg body weight) of fluorodeoxyglucose was administered intravenously. Following a 60-min uptake time, emission PET was obtained with 6 bed positions and was then attenuated with CT data. The CT imaging was performed with the following protocol: 80 to 100 mAs, 120 kVp, 0.5 s/rotation, 2.5-mm slice thickness, and pitch of 0.984: 1. PET images were reconstructed with an ordered subsets expectation maximization algorithm (2 iterations, 14 subsets) for further analyses.
PET/CT data were analyzed using the workstation (Advantage Workstation, 4.3; GE Healthcare Bio-Sciences Corp), and SUVs were acquired with built-in tools. A 3-dimensional region of interest (ROI) was generated around the lesion by a radiology specialist (XX) with over 30 years of experience in abdominal imaging and special competence in nuclear medicine. SUVmax was defined as the maximum SUV within the 3-dimensional ROI. To ensure the minimum variance between tumor volumes measured on CT and threshold-defined PET [17,18], 5 thresholds (35%, 40%, 45%, 50%, and 55%) were tested, and eventually, a threshold of 45% [19] was chosen. The average SUV was calculated within the threshold-defined ROI as SUVmean. The MTV was defined as the tumor volume measured by PET/CT (Figure 1C).
MRI AND HIGH-CELLULARITY TUMOR VOLUME DELINEATION:
MRI was performed on a GE Signa HDX 1.5 T MRI machine (GE Medical Systems) using a torso coil with the patient. For all cases, a standardized MRI protocol was applied. DWI was acquired using a single short spin echo sequence. Scan parameters were as follows: TR/TE=7600/60 ms; field of view (FOV)=350×318 mm2; matrix=164×150; slice thickness=5 to 7 mm; gap=0; number of excitations=2; and b-values=0, 400, and 800 s/mm2. Axial fat-suppressed T2-weighted short-tau inversion recovery images were obtained using the following parameters: TR/TE=5220/49 ms; TI=145 ms; FOV=360 × 360 mm2; slice thickness=5.5 mm; and total acquisition time=2 min 32 s.
The ADC map was automatically generated by the manufacturer’s imaging console and then segmented by another experienced radiologist (QW, with 10 years of specialized training in abdominal imaging) who was blind to patient identity, clinical history, and PET/CT result. Specifically, ROIs were manually drawn along lesions on each slice of the ADC maps to include as much of the abnormality as possible, while adjacent tissues were maximally avoided. The output gross volume was designated as the gross tumor volume (GTV). Within each manually drawn ROI, we used the k-means clustering algorithm to sort tissues into 3 categories: high, intermediate, and low ADC values.
K-means clustering partitioned selected voxels into 3 clusters, in which each voxel belonged to the cluster with the nearest mean, serving as a prototype of the cluster. After classification, the upper threshold for ADC maps was based on the demarcation point between the high and intermediate groups. Therefore, an ADC mask was composed of the voxels below the ADC upper threshold. By excluding the voxels above the ADC upper threshold, the remaining volume was calculated and denoted as high-cellularity tumor volume (HCTVADC). After performing k-means clustering on T2WI, the lower threshold for T2WI was defined as the demarcation point between low and intermediate groups. A mask was composed of the voxels above the lower threshold. Then, a tumor mask was generated by combining the ADC mask and T2WI mask; the overlapping tissue volume was calculated and marked as combined high-cellularity tumor volume (HCTVC). All abovementioned processes were performed using in-house programs (Matlab software, MathWorks, Natick, MA, USA) (Figure 1).
STATISTICAL ANALYSIS:
For continuous variables such as the MTV, GTV, HCTVADC, and HCTVC, the Shapiro-Wilk test was used to determine the normality of the data. Comparisons between the MTV and GTV, HCTVADC, and HCTVC were tested using paired-sample
Results
DEMOGRAPHICS:
A total of 137 lesions from 125 patients were identified on PET/CT images and were homogenous on DWI. Malignancies from all patients were histologically verified by percutaneous biopsy and laparotomy. The rest of the patients were confirmed by clinical follow-up. After excluding lesions with a volume smaller than 2 cm3 on PET/CT, 108 lesions from 108 patients remained. Eventually, a total of 108 patients (male/female=35/73) were included, with a median age of 75 (range 57–86) years. Among them, 65 patients had ovarian cancer (57 serous adenocarcinoma and 8 mucinous adenocarcinoma), 36 had colorectal cancer (15 adenocarcinoma and 21 mucinous adenocarcinoma), and 7 had gastric cancer (7 signet ring cell carcinoma). The details regarding the volumes measured by PET/CT and DWI, respectively, are summarized in Table 1.
COMPARISON BETWEEN TUMOR VOLUMES IN THE GENERAL POPULATION:
Despite the small sample size, the normality of the MTV, GTV, HCTVADC, and HCTVC still held. The GTV differed significantly (P=0.017) from the MTV, with a mean difference of 16.84±6.85 cm3. The difference between the HCTVADC and MTV was also statistically significant (P=0.048), with a mean difference of −5.30±2.62 cm3. The ICC between the GTV and MTV was 0.63, and that between the HCTVADC and MTV was 0.78. On the other hand, no significant difference was found between the HCTVC and MTV (P=0.986), and the mean difference between the HCTVC and MTV was 0.06±3.15 cm3. The ICC between the HCTVC and MTV was 0.99. The association between the MTV and volumes measured by DWI are summarized in Figure 2.
According to the Bland-Altman plot in Figure 3, the upper and lower limits of the 95% confidence interval for the difference between the HCTVC and MTV were 1.30 and −1.19, respectively. The limits of agreement were relatively narrow, and no trend was observed between points above vs below the mean difference line, indicating that there was no proportional bias between the 2 volume measurements. Taking the average between the HCTVC and MTV as the reference lesion volume, the percent error of HCTVC ranged from 18.64% to 61.90%, with a mean error of 28.37%.
COMPARISON BETWEEN TUMOR VOLUMES IN TUMORS WITH DIFFERENT HISTOLOGY:
In the separate analyses conducted in patients with different tumor types, gastric cancer had a significantly larger MTV (
Discussion
Owing to the rich lymph and blood supply of the peritoneum, through which a tumor can spread, peritoneal carcinomatosis is usually extensively disseminated by the time the patient presents to the clinic or hospital [20]. Being the mainstay of therapeutic approaches, surgical planning largely depends on the size and location of the lesion; therefore, the segmentation of peritoneal carcinomatosis has always played an important role in facilitating clinical decision-making and disease evaluation [21,22].
Among all imaging technologies, to date, there is no criterion standard for quantifying tumor volume in vivo. However, the MTV defined by thresholding the SUV is commonly accepted as the metabolic active component of lesions in lung [23], rectal [24], and cervical [25] cancers. This automated method works by selecting high radioactivity concentration regions within the manually drawn rectangular ROI, which could minimize variability between different measurements caused by manually inappropriately selecting adjacent normal tissues. Thus, in the present study, we used the MTV, which is measured in PET/CT, as the reference to make a comparison with MRI-based tumor volume. Owing to its feasibility and reproducibility, regardless of the tumor morphological features, SUVmax is one of the most useful clinical parameters [25]. SUVmean, on the other hand, depends on the threshold used for defining volume, as both fixed [26] and adaptable [27] thresholds are adopted in tumor delineation in PET/CT. In our study, we adopted a fixed 45% threshold of SUVmax for its compatibility with volume measured by CT. To eliminate partial volume effect, we also excluded lesions with a volume lower than 2 cm3.
In recent years, the advent of DWI has added increasing value to tumor evaluation [12]. DWI can detect abnormalities on the basis of tumor cellularity [21] and produces different contrasts than conventional MRI sequences. As an important aid to DWI, the ADC map is widely used for tumor staging, metastases identification, and treatment response evaluation [28–30]. Although the SUV and ADC are based on 2 different cell biological mechanisms, a moderate but significant inverse correlation of the ADC and SUV was found in lesion-based and patient-based analyses [31]. Studies showed that tumor metabolism and cell proliferation correlated with tissue cellularity. As a powerful parameter that reflects restricted diffusion, ADC values are relatively low in tumors compared with in normal tissues. Further study proved that significant inverse associations were found with the ADC vs SUV in peritoneal carcinomatosis, without dependence on primaries [17]. However, the most recent studies are focused on detection of peritoneal carcinomatosis lesions [32]; to date, no research has covered the subject of tumor delineation. As most studies have focused on the delineation of heterogeneous tumors because the variable features of tumors are not suitable for a standardized automatic method, the delineation of homogeneous tumors is also a challenge because all manual segmentation methods can inevitably include unwanted adjacent tissues in ROIs. A previous study supported this assumption that the GTV usually overestimates the tumor tissue volume, even as high as twice its actual value, and the absolute error increases with the increase in tumor size.
The potential value behind the concordance between DWI and PET is the application of ADC maps in peritoneal carcinomatosis delineation. Apart from that, whether the combination of T2WI provides additional value to the increase of delineation accuracy still remains to be discussed. Some researchers proposed the combination of T2WI and DWI to balance the limited spatial resolution of DWI [12,33,34]. The combination of T2WI+DWI+ADC exhibited the best performance [35].Using an ADC map alone, the estimated volume of the HCTVADC in the present study was less satisfactory. The HCTVADC underestimated the volume of tumors, which could lead to omission of lesions and thus deteriorate treatment outcome. With the combination of T2WI and ADC, the HCTVC performed rather well; the slope of linear regression was only 0.947, and the difference between 2 measurements was not significant. The homogeneous MR signal intensity of peritoneal carcinomatosis might be the cause of this. Essentially, T2WI alone did not possess the capability to characterize tissues at the microscopic level [22] and therefore could ignore infiltrating lesions with normal morphological characteristics but that bear invasiveness [36]. To detect peritoneal carcinomatosis, the sensitivity of using MRI alone was only 58%, the specificity was 87%, and the accuracy was 67% in a previous study [21]. After adding high b-value DWI to conventional MR, the sensitivity and specificity could reach 0.83 and 0.94, respectively [21]. Even T2 shine-through effects and perfusion in vascular-rich tissue could be overcome by the use of higher b-values [37] and generation of ADC parametric maps. The HCTVC was generated by removing hypointense pixels on T2WI, which represent unwanted noise, fat, and fibrous tissues, and high ADC values, which represent cyst, necrosis, and low-cellularity normal tissues; the overlapping parts that remained were considered high-cellularity tumor tissues [38]. K-means clustering has been widely used to separate different tissue types in various studies [36,38–40]. Some studies proposed discarding the highest ADC cluster, considered normal or cystic tissues, and the lowest ADC cluster, regarded as fibrous or fat tissues. In the present study, we adopted a similar method to Gong et al [38]. Considering that noise exhibits low intensity on T2WI and extreme values on ADC maps [38], some random noise on ADC maps might mimic non-tumorous tissues. Thus, we used the T2WI to generate a low signal cluster to achieve more accuracy. Despite the difference in cluster selection, the common goal of all these methods was to remove the non-tumorous tissues, such as cysts, necrosis, and normal tissues and fluid, and the proper choice of method might largely depend on the characteristics of a specific dataset. Moreover, T2WI was used in the present study instead of b0 images. As mentioned in a previous study [38], b0 images and ADC maps are almost co-registered, which makes the fusion between the 2 modalities easier, given that motion artifacts can be greatly overcome. However, T2WI provides better spatial resolution and soft-tissue contrast than b0 images [22,41], which makes the information in T2WI and DWI mutually complementary.
There are also limitations to this study. The relatively small sample size could have limited us from undertaking further meaningful patient-based analysis. In terms of the tumor size, we excluded regions smaller than 2 cm3 on PET/CT to avoid partial volume effect. The lack of data on miliary lesions somewhat limits the application of this approach; future studies are needed to fill in the blanks. The histological types of primary tumors also varied, which could complicate the study with unknown factors. Moreover, the fact that only 1 radiologist segmented all the lesions hindered us from evaluating the inter-rater reliability of the approach. Thus, compared with PET/CT, the advantages of MRI, such as its relatively low cost, being radiation free, requiring no contrast agent, and having high accessibility, might make it acceptable to serve as an alternative imaging tool.
Conclusions
In the current study, the tumor volume delineated by DWI and T2WI showed high consistency with the MTV generated by PET/CT in patients with peritoneal carcinomatosis. This suggests the potential value of this semiautomatic method serving as an alternative to PET/CT in radiotherapy tumor contouring. Future studies are needed to overcome the main limitations of the present study, and a prospective validation study is also needed.
Figures
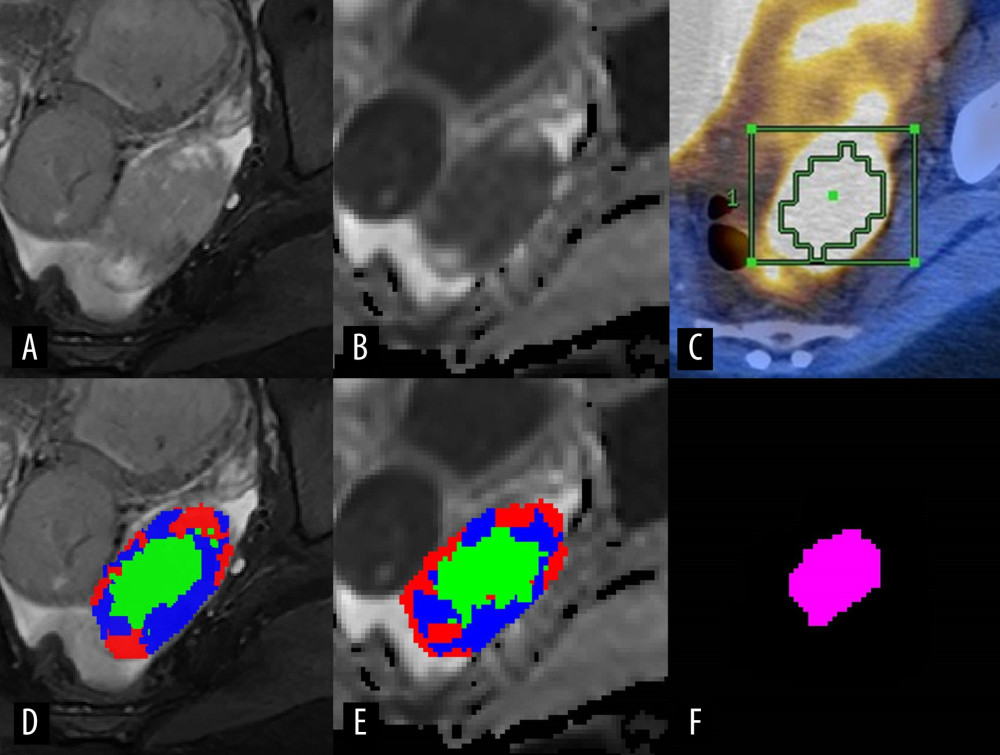 Figure 1. Representative case presenting the combined high-cellularity tumor volume (HCTVC) segmented by both T2-weighted imaging (T2WI) and diffusion-weighted imaging (DWI), as compared with the metabolic tumor volume (MTV) defined in positron emission tomography with computed tomography (PET/CT). (A) T2WI and (D) manually drawn region of interest (ROI), divided into 3 clusters. (B) Apparent diffusion coefficient (ADC) map and (E) manually drawn ROI, divided into 3 clusters. (C) PET/CT and manually drawn ROI, generated by using 45% maximum standard uptake value as the lower threshold. (F) The HCTVC was obtained by excluding low-intensity pixels on T2WI and high ADC pixels on ADC maps.
 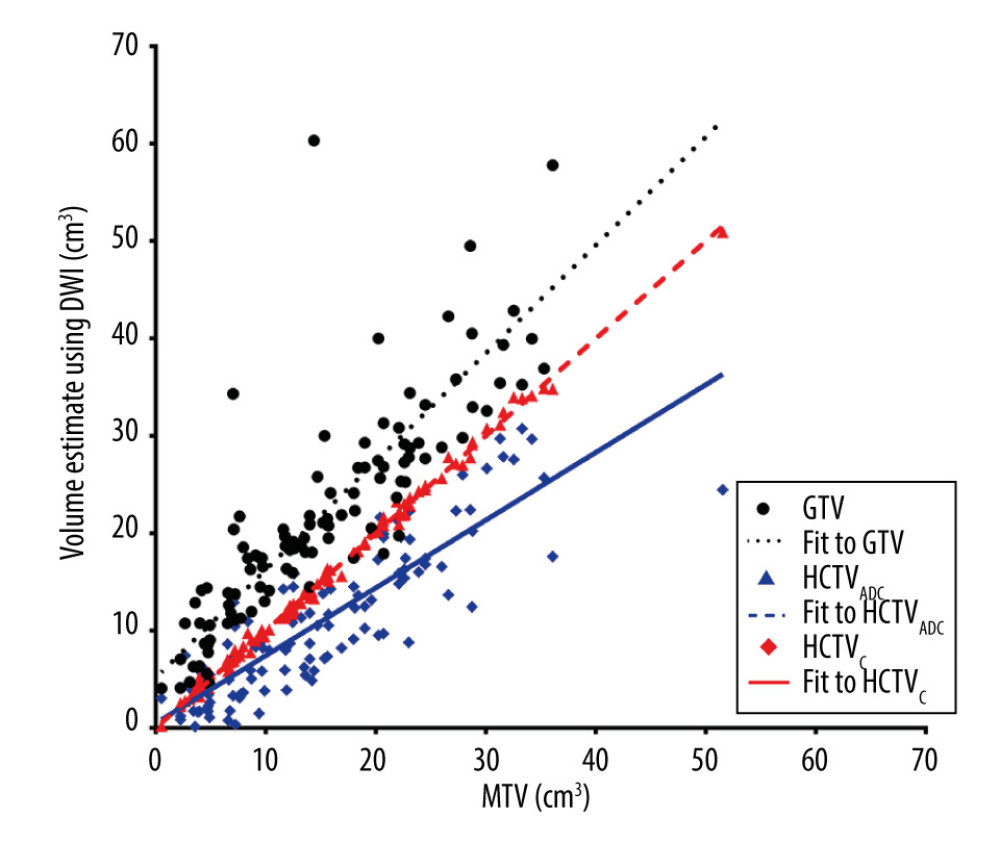 Figure 2. Scatterplot of volume estimates using magnetic resonance imagining vs that using positron emission tomography with computed tomography; corresponding linear regression fit lines were also added.
 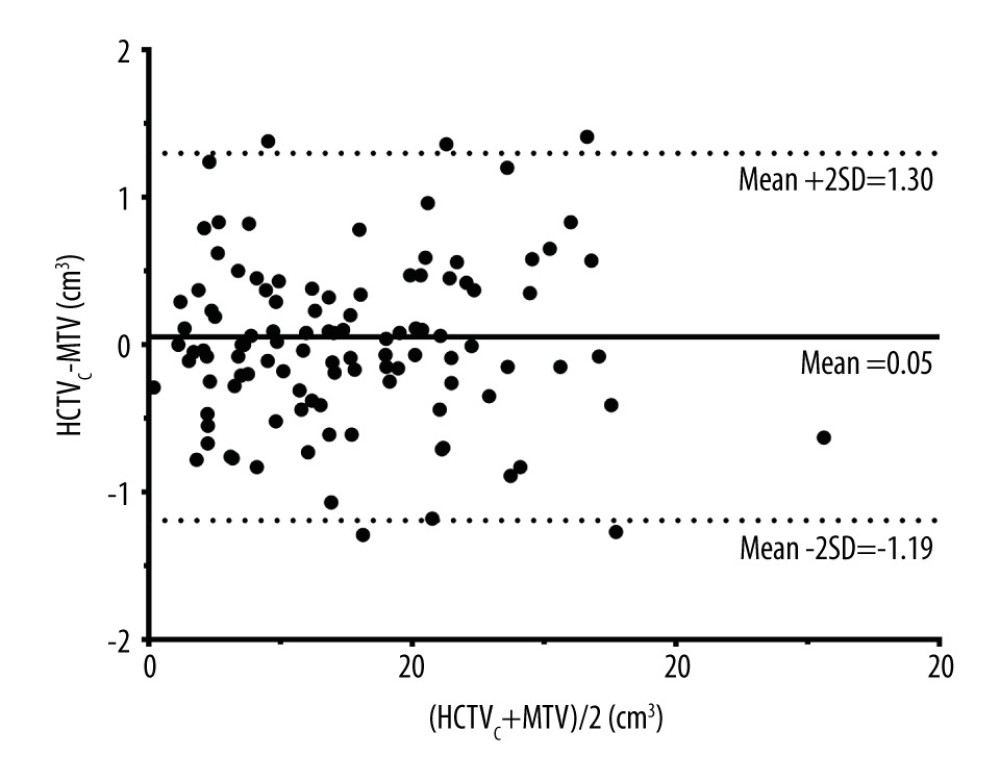 Figure 3. Bland-Altman plot showing no proportional bias between the combined high-cellularity tumor volume (HCTVC) and metabolic tumor volume (MTV). The 3 reference lines from top to bottom are the upper 95% confidence limit, mean difference, and lower 95% confidence limit, respectively.
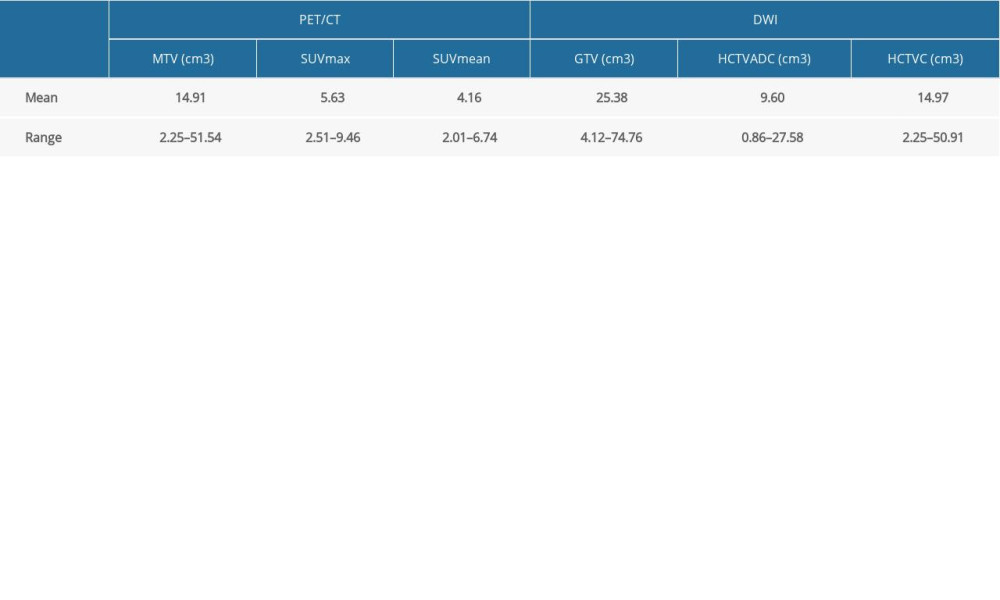
References
1. Healy JC, Reznek RH, The peritoneum, mesenteries and omenta: normal anatomy and pathological processes: Eur Radiol, 1998; 8; 886-900
2. Pyrhönen S, Kuitunen T, Nyandoto P, Kouri M, Randomised comparison of fluorouracil, epidoxorubicin and methotrexate (FEMTX) plus supportive care with supportive care alone in patients with non-resectable gastric cancer: Br J Cancer, 1995; 71; 587-91
3. Vasseur B, Cadiot G, Zins M, Peritoneal carcinomatosis in patients with digestive endocrine tumors: Cancer, 1996; 78; 1686-92
4. Raue W, Tsilimparis N, Langelotz C, Initial results after implementation of a multimodal treatment for peritoneal malignancies: Acta Chir Belg, 2011; 111; 68-72
5. Hamilton T, Lanuke K, Mack LA, Temple WJ, Long-term follow-up in the treatment of peritoneal carcinomatosis: Am J Surg, 2011; 201; 650-54
6. Gill RS, Al-Adra DP, Nagendran J, Treatment of gastric cancer with peritoneal carcinomatosis by cytoreductive surgery and HIPEC: A systematic review of survival, mortality, and morbidity: J Surg Oncol, 2011; 104; 692-98
7. González-Moreno S, González-Bayón L, Ortega-Pérez G, González-Hernando C, Imaging of peritoneal carcinomatosis: Cancer J, 2009; 15; 184-89
8. Vicens RA, Patnana M, Le O, Multimodality imaging of common and uncommon peritoneal diseases: A review for radiologists: Abdom Imaging, 2015; 40; 436-56
9. Soussan M, Des Guetz G, Barrau V, MR with diffusion-weighted imaging for assessing peritoneal carcinomatosis from gastrointestinal malignancy: Eur Radiol, 2012; 22; 1479-87
10. Berthelot C, Morel O, Girault S, Use of FDG-PET/CT for peritoneal carcinomatosis before hyperthermic intraperitoneal chemotherapy: Nucl Med Commun, 2011; 32; 23-29
11. Satoh Y, Ichikawa T, Motosugi U, Diagnosis of peritoneal dissemination: Comparison of 18F-FDG PET/CT, diffusion-weighted MRI, and contrast-enhanced MDCT: Am J Roentgenol, 2011; 196; 447-53
12. Low RN, Sebrechts CP, Barone RM, Muller W, Diffusion-weighted MRI of peritoneal tumors: Comparison with conventional MRI and surgical and histopathologic findings – a feasibility study: Am J Roentgenol, 2009; 193; 461-70
13. Fujii S, Matsusue E, Kanasaki Y, Detection of peritoneal dissemination in gynecological malignancy: Evaluation by diffusion-weighted MR imaging: Eur Radiol, 2008; 18; 18-23
14. Koh D-M, Collins DJ, Diffusion-weighted MRI in the body: Applications and challenges in oncology: Am J Roentgenol, 2007; 188; 1622-35
15. Levy AD, Shaw JC, Sobin LH, From the archives of the AFIP: Secondary tumors and tumorlike lesions of the peritoneal cavity: Imaging features with pathologic correlation: Radiographics, 2009; 29; 347-73
16. Popp I, Bott S, Mix M, Diffusion-weighted MRI and ADC versus FET-PET and GdT1w-MRI for gross tumor volume (GTV) delineation in re-irradiation of recurrent glioblastoma: Radiother Oncol, 2019; 130; 121-31
17. Yu X, Lee EYP, Lai V, Chan Q, Correlation between tissue metabolism and cellularity assessed by standardized uptake value and apparent diffusion coefficient in peritoneal metastasis: J Magn Reson Imaging, 2014; 40; 99-105
18. Gupta A, Sharma P, Patel CD, Size-dependent thresholding as an optimal method for tumor volume delineation on positron emission tomography-computed tomography: A Phantom study: Indian J Nucl Med, 2011; 26; 22-26
19. Xiang ZQ, Imani S, Hu Y, Comparison of different images in gross target volume delineating on VX2 nasopharyngeal transplantation tumor models: J Cancer, 2020; 11; 1104-14
20. Klaver YLB, Lemmens VEPP, de Hingh IH, Outcome of surgery for colorectal cancer in the presence of peritoneal carcinomatosis: Eur J Surg Oncol, 2013; 39; 734-41
21. Bozkurt M, Doganay S, Kantarci M, Comparison of peritoneal tumor imaging using conventional MR imaging and diffusion-weighted MR imaging with different b values: Eur J Radiol, 2011; 80; 224-28
22. Low RN, MR imaging of the peritoneal spread of malignancy: Abdom Imaging, 2007; 32; 267-83
23. Spratt DE, Diaz R, McElmurray J, Impact of FDG PET/CT on delineation of the gross tumor volume for radiation planning in non-small-cell lung cancer: Clin Nucl Med, 2010; 35; 237-43
24. Ciernik IF, Huser M, Burger C, Automated functional image-guided radiation treatment planning for rectal cancer: Int J Radiat Oncol, 2005; 62; 893-900
25. Ho K-C, Lin G, Wang J-J, Correlation of apparent diffusion coefficients measured by 3T diffusion-weighted MRI and SUV from FDG PET/CT in primary cervical cancer: Eur J Nucl Med Mol Imaging, 2009; 36; 200-8
26. Miller TR, Grigsby PW, Measurement of tumor volume by PET to evaluate prognosis in patients with advanced cervical cancer treated by radiation therapy: Int J Radiat Oncol Biol Phys, 2002; 53; 353-59
27. Biehl KJ, Kong F-M, Dehdashti F, 18F-FDG PET definition of gross tumor volume for radiotherapy of non-small cell lung cancer: Is a single standardized uptake value threshold approach appropriate?: J Nucl Med, 2006; 47; 1808-12
28. Matoba M, Tonami H, Kondou T, Lung carcinoma: Diffusion-weighted MR imaging – preliminary evaluation with apparent diffusion coefficient: Radiology, 2007; 243; 570-77
29. Gourtsoyianni S, Papanikolaou N, Yarmenitis S, Respiratory gated diffusion-weighted imaging of the liver: Value of apparent diffusion coefficient measurements in the differentiation between most commonly encountered benign and malignant focal liver lesions: Eur Radiol, 2008; 18; 486-92
30. Dudeck O, Zeile M, Pink D, Diffusion-weighted magnetic resonance imaging allows monitoring of anticancer treatment effects in patients with soft-tissue sarcomas: J Magn Reson Imaging, 2008; 27; 1109-13
31. Schwenzer NF, Schmidt H, Gatidis S, Measurement of apparent diffusion coefficient with simultaneous MR/positron emission tomography in patients with peritoneal carcinomatosis: Comparison with 18F-FDG-PET: J Magn Reson Imaging, 2014; 40; 1121-28
32. Kyriazi S, Collins DJ, Morgan VA, Diffusion-weighted imaging of peritoneal disease for noninvasive staging of advanced ovarian cancer: Radiographics, 2010; 30; 1269-85
33. Trebeschi S, Van Griethuysen JJM, Lambregts DMJ, Deep learning for fully-automated localization and segmentation of rectal cancer on multiparametric MR: Sci Reports, 2017; 7; 5301
34. Zhu HT, Zhang XY, Shi YJ, Automatic segmentation of rectal tumor on diffusion-weighted images by deep learning with U-Net: J Appl Clin Med Phys, 2021; 22; 324-31
35. Lai CC, Wang HK, Wang FN, Autosegmentation of prostate zones and cancer regions from biparametric magnetic resonance images by using deep-learning-based neural networks: Sensors, 2021; 21(8); 2709
36. Lee EYP, An H, Perucho JAU, Functional tumour burden of peritoneal carcinomatosis derived from DWI could predict incomplete tumour debulking in advanced ovarian carcinoma: Eur Radiol, 2020; 30; 5551-59
37. Padhani AR, Liu G, Koh DM, Diffusion-weighted magnetic resonance imaging as a cancer biomarker: Consensus and recommendations: Neoplasia, 2009; 11; 102-25
38. Gong N-J, Wong C-S, Chu Y-C, Increasing the accuracy of volume and ADC delineation for heterogeneous tumor on diffusion-weighted MRI: Correlation with PET/CT: Int J Radiat Oncol Biol Phys, 2013; 87; 407-13
39. Verma R, Zacharaki EI, Ou Y, Multiparametric tissue characterization of brain neoplasms and their recurrence using pattern classification of MR images: Acad Radiol, 2008; 15; 966-77
40. Lai AYT, Perucho JAU, Xu X, Concordance of FDG PET/CT metabolic tumour volume versus DW-MRI functional tumour volume with T2-weighted anatomical tumour volume in cervical cancer: BMC Cancer, 2017; 17; 825
41. Zhao X, Xie P, Wang M, Deep learning-based fully automated detection and segmentation of lymph nodes on multiparametric-mri for rectal cancer: A multicentre study: EBioMedicine, 2020; 56; 102780
Figures
Figure 1. Representative case presenting the combined high-cellularity tumor volume (HCTVC) segmented by both T2-weighted imaging (T2WI) and diffusion-weighted imaging (DWI), as compared with the metabolic tumor volume (MTV) defined in positron emission tomography with computed tomography (PET/CT). (A) T2WI and (D) manually drawn region of interest (ROI), divided into 3 clusters. (B) Apparent diffusion coefficient (ADC) map and (E) manually drawn ROI, divided into 3 clusters. (C) PET/CT and manually drawn ROI, generated by using 45% maximum standard uptake value as the lower threshold. (F) The HCTVC was obtained by excluding low-intensity pixels on T2WI and high ADC pixels on ADC maps.Figure 2. Scatterplot of volume estimates using magnetic resonance imagining vs that using positron emission tomography with computed tomography; corresponding linear regression fit lines were also added.Figure 3. Bland-Altman plot showing no proportional bias between the combined high-cellularity tumor volume (HCTVC) and metabolic tumor volume (MTV). The 3 reference lines from top to bottom are the upper 95% confidence limit, mean difference, and lower 95% confidence limit, respectively. In Press
05 Mar 2024 : Clinical Research
Muscular Function Recovery from General Anesthesia in 132 Patients Undergoing Surgery with Acceleromyograph...Med Sci Monit In Press; DOI: 10.12659/MSM.942780
05 Mar 2024 : Clinical Research
Effects of Thermal Insulation on Recovery and Comfort of Patients Undergoing Holmium Laser LithotripsyMed Sci Monit In Press; DOI: 10.12659/MSM.942836
05 Mar 2024 : Clinical Research
Role of Critical Shoulder Angle in Degenerative Type Rotator Cuff Tears: A Turkish Cohort StudyMed Sci Monit In Press; DOI: 10.12659/MSM.943703
06 Mar 2024 : Clinical Research
Comparison of Outcomes between Single-Level and Double-Level Corpectomy in Thoracolumbar Reconstruction: A ...Med Sci Monit In Press; DOI: 10.12659/MSM.943797
Most Viewed Current Articles
17 Jan 2024 : Review article
Vaccination Guidelines for Pregnant Women: Addressing COVID-19 and the Omicron VariantDOI :10.12659/MSM.942799
Med Sci Monit 2024; 30:e942799
14 Dec 2022 : Clinical Research
Prevalence and Variability of Allergen-Specific Immunoglobulin E in Patients with Elevated Tryptase LevelsDOI :10.12659/MSM.937990
Med Sci Monit 2022; 28:e937990
16 May 2023 : Clinical Research
Electrophysiological Testing for an Auditory Processing Disorder and Reading Performance in 54 School Stude...DOI :10.12659/MSM.940387
Med Sci Monit 2023; 29:e940387
01 Jan 2022 : Editorial
Editorial: Current Status of Oral Antiviral Drug Treatments for SARS-CoV-2 Infection in Non-Hospitalized Pa...DOI :10.12659/MSM.935952
Med Sci Monit 2022; 28:e935952