10 August 2021: Database Analysis
Identification of m6A-Related Biomarkers Associated with Prognosis of Colorectal Cancer
Zhiyong Zhang1ABCDEF*, Xin Zhang1EFDOI: 10.12659/MSM.932370
Med Sci Monit 2021; 27:e932370


Abstract
BACKGROUND: Colorectal cancer (CRC) is the second most deadly cancer in the world according to GLOBOCAN 2020 data. Accumulating evidence suggests that RNA methylation modification is also misregulated in human cancers and may be a potential ideal target for cancer treatment.
MATERIAL AND METHODS: m6A-related differentially expressed genes (DEGs) were identified from colon adenocarcinoma and rectum adenocarcinoma esophageal carcinoma patients with different pathological stages. The protein-protein interaction (PPI) network construction, Gene Ontology (GO), and Kyoto Encyclopedia of Genes and Genomes (KEGG) pathway enrichment analyses of DEGs were conducted. Cox regression analysis was applied to the screening of m6A-related DEGs significantly associated with the overall survival (OS), and those selected genes were used for LASSO regression analysis to construct prognostic signature and calculate patients’ risk scores.
RESULTS: We identified 673 m6A-related DEGs from CRC patients in different pathologic stages, and 146 of them were associated with OS. CTNNB1, TRIM37, RAB7A, CASC5/KNL1, CENPE, CCNB1, UBE2H, HSPA8, KIF1A, and FBXW4 were hub genes of the PPI network. Nine m6A-related genes were screened out to build the prognostic risk model. TNM stage, vascular invasion, and the risk score were independently related to the OS of CRC patients.
CONCLUSIONS: Nine candidate m6A-related mRNA biomarkers (LRRC17, NFKB1, NOS2, PCDHB2, RAB7A, RPS6KA1, RRNAD1, TLE6, and UBE2H) were found to be closely related to the clinicopathology and prognosis of colorectal cancer, indicating that they could be potential prognostic biomarkers for patients with colorectal cancer.
Keywords: Colorectal Neoplasms, N6-methyladenosine (m6A), Biomarkers, Tumor, Colonic Neoplasms, Datasets as Topic, Epigenesis, Genetic, Esophageal Neoplasms, Gene Expression Profiling, Gene Regulatory Networks, Methylation, Protein Interaction Maps, Rectal Neoplasms
Background
Colorectal cancer, also known as bowel cancer, colon cancer, or rectal cancer, is a cancer formed by uncontrolled cell growth in the colon or the rectum (part of the large intestine), or in the appendix. According to GLOBOCAN 2020 data, colorectal cancer (CRC) is the second most deadly and third most prevalent cancer in the world [1]. The incidence of CRC worldwide has been steadily increasing, accounting for 10% of all cancer diagnoses [2]. By 2020, CRC was the second most deadly cancer in the world, with an estimated 1.9 million new cases and 935 000 deaths. Meanwhile, the global burden of CRC is expected to increase by 60%, with nearly 2.2 million new cases and 1.1 million deaths expected by 2030 [3]. About 20% of CRC patients present with synchronous metastases, most commonly in the liver, and up to 60% of the patients develop distant metastases within 5 years [4]. Therefore, it is urgent to determine genetic and environmental risk factors that may affect the prognosis of CRC patients in clinical practice. Recently, with the help of high-throughput sequencing technology, a breakthrough has been made in the identification of CRC biomarkers at the cellular and molecular levels, which would potentially improve the prognostic prediction accuracy and introduce new therapeutic targets for CRC patients.
Since the discovery of first structurally modified nucleoside, pseudouridine, in the 1950s, more than 150 different chemical modifications have been identified on cellular RNA so far [5]. m6A methylation is the most characteristic mRNA modification and has been the most extensively studied since its discovery [6,7]. The most common methylation modification in eukaryotic mRNA is N6-methyladenosine (m6A), which accounts for more than 80% of all RNA base methylation and exists in various species [8]. The abundance and effects of m6A on RNA depend on the dynamic interplay between its methyltransferase (“writers”, such as METTL3, METTL14, WTAP, KIAA1429, ZC3H13, and METTL16), binding protein (“readers”, such as YTH domain-containing proteins and MRB1) and demethylase (“erasers”, such as FTO and ALKBH5) [9]. Accumulating evidence suggests that RNA methylation modification is also misregulated in human cancers and may be a potential ideal target for cancer treatment [10]. m6A methylation modification affects multiple aspects of RNA metabolism, ranging from RNA processing, nuclear export, RNA translation, to decay [11]. In addition, research proved that m6A methylation modification of mRNA and non-coding RNA plays an important role in a variety of common cancers, including solid tumors and non-solid tumors, and regulates cell proliferation and migration in cancer by affecting the biological functions of cells, tumor cell differentiation, and homeostasis [12,13]. Therefore, by finding m6A-related genes and m6A RNA methylation modification sites in cancer, new therapeutic targets could be provided for cancer treatment. Recently, studies focused on the role of m6A-related genes and their methylation regulators have revealed that METTL3 interacts with the microprocessor protein DGCR8 and actively regulates the pri-miR221/222 process in an m6A-dependent manner, which possibly has a carcinogenic effect in bladder cancer [14]. The reduction of RNA m6A methylation can activate oncogenic Wnt/PI3K-Akt signaling and promote malignant phenotypes of gastric cancer cells [15].
In the study, signature analysis with clinical information was performed for determining the m6A-related genes expression profile of patients with COAD (colon adenocarcinoma) and READ (rectum adenocarcinoma esophageal carcinoma) from TCGA database and Gene Expression Omnibus (GEO) databases. LASSO and Cox regression aided identification of potential m6A-related genes to predict the survival of patients with colorectal cancer. We determined 9 prognostic m6A-related genes from TCGA dataset and further validated the model in GEO dataset. The results obtained in this study would help to predict the prognosis of CRC patients and improve personalized treatment and management.
Material and Methods
DATASETS ACQUISITION:
RNA expression data and clinical information of primary CRC tissues were downloaded from TCGA database (
IDENTIFICATION OF M6A-RELATED GENE SET:
Currently known m6A RNA methylation regulators include methyltransferase (METTL3, METTL14, METTL16, WTAP, KIAA1429, RBM15, and ZC3H13), binding protein (YTHDC1, YTHDC2, YTHDF1, YTHDF2, YTHDF3, and HNRNPC), and demethylase (ALKBH5 and FTO). There wer 3412 m6A-related genes correlated with CRC identified from the m6Avar database (http://rmvar.renlab.org/) [16]. The candidate m6A-related gene set was obtained by removing duplicate genes and the genes with no expression value or expression value less than 80% of total expression value in the samples. After refinement, 3161 candidate genes were kept for further analysis.
M6A-RELATED DEGS FROM PATIENTS WITH DIFFERENT PATHOLOGICAL STAGES:
To investigate the expression difference of m6A-related genes in different pathological stages, one-way ANOVA was used for identifying differentially expressed genes (DEGs) among 4 pathological stages. After removing samples without specific pathological stages, 620 tumor samples of CRC patients were left for further evaluation. Subsequently, all the differential expression analysis was executed with the threshold of
SURVIVAL ANALYSIS:
Univariate Cox regression analysis was employed to identify m6A-related genes associated with the prognosis of CRC patients. According to the expression of genes, we classified the patients into high or low expression groups. With the survival time and survival status (live or dead) as input files, the overall survival (OS) probability between high or low expression groups was calculated and compared. OS of every CRC tumor sample was estimated by Kaplan-Meier method. The log-rank test was used to determine the significance of OS probability between different subgroups.
After that, the OS related genes were used for LASSO-Cox regression analysis to construct the prognostic model of these m6A-related genes with R package glmnet [23–25]. Ten-fold cross-validation minimum criteria were used to select the least-squares minimum value (min) with the minimum mean across validation error. Finally, we used to prognostic model to screen the gene set and calculate each patient’s risk score by a standard formula, which combines the expression levels of m6A-related genes with LASSO-Cox regression coefficients. To confirm whether the risk score independently affected the patients’ OS, the multivariate Cox regression model was used to assessed the association of pathoclinical features with the OS.
CONSTRUCTION OF PPI NETWORK:
The search tool for the retrieval of interacting genes (STRING database, V11; http://string-db.org/) was employed to predict the protein-protein interactions network of prognostic m6A-related DEGs [17]. On the STRING website, after put prognostic m6A-related DEGs, the website will show PPI network files according to its internal database. Subsequently, Cytoscape software (http://cytoscape.org/) was applied to visualize and analyze biological networks and node degrees of the 146 candidate genes based on a confidence score >0.4 [18].
GENE ONTOLOGY AND KEGG PATHWAY ENRICHMENT ANALYSIS:
Gene ontology (GO) is a tool for gene annotation using a dynamic, controlled vocabulary that classifies genes into 3 categories: biological process, molecular function, and cellular component [19,20]. GO analysis uses different genes to annotate gene functions based on the GO database. After obtaining all the functions involved in the genes, Fisher’s exact test and multiple comparison test are used to calculate the significance level (P value) and false positive rate (FDR) of each function, to screen out the significant functions embodied by the differentially expressed genes. Kyoto Encyclopedia of Genes and Genomes (KEGG) database is used to assign gene sets to specific pathway maps of molecular interactions, reactions, and relation networks [21]. At present, KEGG Pathway is divided into 8 categories: overall network, metabolic processes, genetic information transmission, environmental information transmission, intracellular biological processes, biological systems, human diseases, and drug development. Pathway analysis was based on the KEGG database, using Fisher’s exact test and chi-square test for differentially expressed genes to analyze the significance of the pathway participated by the target gene.
GO functional annotation and KEGG pathway enrichment analyses of DEGs were performed by R package clusterProfiler [22] with P value <0.05 as statistically significant to further explore the functions and involved pathways of differentially expressed m6A-related genes.
STATISTICAL ANALYSIS:
All statistical analyses were conducted in R program (version 4.0.3; https://www.r-project.org/). Survival analysis was performed using Kaplan-Meier method and log-rank test with R package “survival” [26], while survival curves were plotted by “SurvMiner” package [27]. Cox proportional risk regression model was used for multivariate analysis. For all statistical tests, a P value of 0.05 was considered significant.
Results
IDENTIFICATION OF DIFFERENTIALLY EXPRESSED M6A-RELATED GENES FROM PATIENTS WITH DIFFERENT PATHOLOGICAL STAGES:
We selected 15 m6A RNA methylation regulators and 3412 m6A RNA methylation-related genes. After removing duplicate genes and the genes with no expression value or expression values less than 80% of total expression value in the samples, 3161 candidate genes were kept for further analysis. The workflow was shown in Figure 1. Subsequently, a total of 673 differentially expressed genes (DEGs) were identified by one-way ANOVA analysis among different stages (Figure 2). Notably, 4 m6A RNA methylation regulatory factors, including methyltransferase like 14 (METTL14), YTH domain containing 2 (YTHDC2), YTH N6-methyladenosine RNA binding protein 2 (YTHDF2), and zinc finger CCCH-type containing 13 (ZC3H13), were significantly differentially expressed among the 4 pathological subgroups. The expression profile of METTL14, YTHDC2, and YTHDF2 exhibited sustained decreasing with the progression of CRC, while the expression level of ZC3H13 was steadily elevated during CRC development (Supplementary Figure 1).
SCREENING OF PROGNOSTIC M6A-RELATED GENES:
To obtain prognostic m6A-related genes, univariate Cox regression analysis was performed with the threshold of P value <0.05. As a result, a total of 146 m6A-related genes were found to be associated with the overall survival of CRC patients (Supplementary Table 1).
PROTEIN–PROTEIN INTERACTION NETWORK OF THE M6A-RELATED DEGS:
The PPI networks for m6A-related genes were constructed according to the STRING database. The NetworkAnalyzer module was used to analyze and compare the network, hub genes were identified by analyzing the network topology. The top 10 hub genes were catenin beta 1 (CTNNB1), tripartite motif containing 37 (TRIM37), member RAS oncogene family (RAB7A), kinetochore scaffold 1 (CASC5/KNL1), centromere protein E (CENPE), G2/mitotic-specific cyclin-B1 (CCNB1), ubiquitin conjugating enzyme E2 H (UBE2H), heat shock protein family A (Hsp70) member 8 (HSPA8), kinesin family member 1A (KIF1A), and F-box and WD repeat domain containing 4 (FBXW4) (Figure 3).
FUNCTIONAL ANNOTATION OF M6A-RELATED GENES:
To further explore the biological functions and involved pathways of prognostic m6A-related genes, we used R package clusterProfiler to perform GO function annotation and KEGG pathway enrichment analysis. The most significant (P value <0.05) GO terms and KEGG pathways are shown in Figure 4. Results indicated that cerebral cortex neuron differentiation, forebrain development, digestive tract development, digestive system development, and odontogenesis of dentin-containing teeth were the top 5 significantly enriched GO terms in biological process category, while pathways of neurodegeneration-multiple diseases, small cell lung cancer, Amoebiasis, Tuberculosis and HIF-1 signaling pathway were the top 5 significantly enriched KEGG pathways.
CONSTRUCTION OF THE PROGNOSTIC RISK MODEL:
After 1000 resamples by Least Absolute Shrinkage and Selection Operator (LASSO) Cox regression analysis through “glmnet” and “survival” R package, 9 m6A-related genes were selected to construct the prognostic model (Figure 5). Based on the gene signature with LASSO coefficients, the risk score=(0.02327*LRRC17)+ (0.8170*NFKB1)+ (0.07971*NOS2)+ (0.1193* PCDHB2)+ (0.006866*RAB7A)+ (0.07122*RPS6KA1)+ (−0.0897*RRNAD1)+ (0.3128*TLE6)+ (−0.06165*UBE2H). The TCGA cohort was then split into the high- and low-risk groups according to the median value of prognostic risk score. Kaplan-Meier survival analysis showed that patients with lower risk scores had significantly better overall survival than those with higher risk scores (P<0.0001) (Figure 5A). As shown in Figure 5B, the expression of RRNAD1 and UBE2H was negatively associated with the risk score of colorectal cancer patients, while the expression of other genes was positively associated with the risk score of patients with colorectal cancer. We also visualized the risk score distribution according to the length of follow-up months (Figure 5C). In the TCGA datasets, a significant positive correlation was found between the expression of NOS2 and TLE6 (Figure 5D). Figure 6A and 6B showed screening process of 9 m6A-related prognostic genes by LASSO-Cox regression analysis and random permutation. In Figure 6A, each line represents one gene, and the gene with non-zero coefficients was kept. In Figure 6B, when the line trends to flat, the lamda value would be chosen to conduct regression model. To verify whether these candidate prognostic gene models were influenced by clinical factors such as age, TNM stage and sex, we performed multivariate Cox regression analysis. The results showed that TNM stage, the status of vascular invasion, and the risk score were all independently related to the OS of TCGA CRC patients (Figure 6C).
VALIDATION OF THE PROGNOSTIC MODEL:
Concurrently, the prognostic risk score of the m6A-related signature was also validated in the GSE39582 dataset. In the exploration, the median risk score of 573 patients in GSE39582 was calculated as 2.188 according to the risk score formula, among which 286 patients with a score <2.188 were assigned as the low-risk group, while other 287 patients with a score ≥2.188 specified as the high-risk group. Patients with lower risk score had significantly longer overall survival than those with higher risk score in the validation set (P value=0.0082, Figure 7). Multivariate Cox regression analysis also showed that risk score was a prognostic factor for CRC patients’ OS (Figure 6D).
Discussion
Colorectal cancer is one of the most lethal solid tumors, with complex molecular and cellular heterogeneity. In the past few decades, there has been a great deal of research focusing on the molecular mechanisms of colorectal cancer, but most of them have concentrated on the aberration of protein-coding genes, leaving post-transcriptional processes mysterious. However, post-transcriptional alterations play a significant role in the preservation of tumor cells by modulating every hallmark in cancer [28,29]. RNA methylation modifications compose over 60% of all RNA modifications, and the most common type of RNA methylation modification is N6-methyladenosine (m6A) RNA methylation [30]. Accumulating evidence suggests that m6A modification plays a critical role not only in hypertension and cardiovascular disease, but also in tumor genesis and metastasis [31]. Therefore, the identification of m6A-related genes and m6A RNA methylation regulators abnormal expression may improve our understanding of colorectal cancer and provide us with valuable therapeutic targets.
Previous study about CRC and m6A methylation focused on m6A regulators [32], one subtype of CRC, such as COAD [33], or the comparison of tumor and normal tissues [34]. In the study, we systematically analyzed RNA sequencing data of CRC (including COAD and READ) patients from TCGA and GEO database. The m6A RNA methylation-related genes and m6A regulators were both brought into this investigation. We found that 673 candidate m6A RNA methylation-related genes were abnormally expressed among different pathological stages. Moreover, based on TCGA dataset, 146 m6A-related genes were related to patients’ overall survival based on the result of univariate Cox regression analysis. By constructing the PPI network, we identified 10 hub genes, namely CTNNB1, TRIM37, RAB7A, CASC5/KNL1, CENPE, CCNB1, UBE2H, HSPA8, KIF1A and FBXW4. CTNNB1 is a key component of the Wnt/β-catenin signaling pathway and was identified as the regulator of m6A modification in hepatoblastoma induced by METTL3 [35]. Liu et al found that Sec62 is upregulated by the METTL3-mediated m6A modification and promotes the stemness and chemoresistance of CRC by binding to β-catenin and enhancing Wnt signaling [36]. That might indicate that the WNT/β-catenin pathway should receive more attention in further study. A case-control study of breast cancer demonstrated that KIF1A promoter methylation can distinguish breast cancer (BC) cases from controls in plasma and was inversely associated with DNA repair ability (DRC) levels [37]. Studies confirmed that CCNB1 silencing can activate the p53 signaling pathway, further inhibit cell proliferation, and promote cell senescence in pancreatic cancer [38]. Meanwhile, in a systematic analysis of melanoma, it was proved to be positively correlated with either YTHDF1 or HNRNPA2B1, suggesting that both genes may affect m6A modification by CCNB1 gene [39].
To further investigate the influence of m6A RNA methylation regulatory factors on the prognosis of colorectal cancer, we used LASSO-Cox regression to establish a prognostic risk model based on 9 m6A RNA methylation-related genes. Survival analysis showed that the high-risk and low-risk subgroups classified by the model did have different prognostic destination in both the TCGA training group and the validation set. Although there has been no earlier research to prove that the biomarkers, we found in the prognostic model a close relationship with RNA modification process, but some of them (GSR and S1PR3) were correlated with the apoptosis and the adaption of acidic microenvironment of CRC cells [40,41]. Further experimental validation of the relationship between those biomarker genes and m6A RNA methylation regulators is needed to test the feasibility of our prognostic model.
Conclusions
In summary, our study systematically analyzed the expression profile of m6A RNA methylation-related genes, their prognostic significance, potential functions and pathways, and protein-protein interactions from CRC patients with the help of TCGA and GEO databases. Nine candidate m6A-related mRNA biomarkers (LRRC17, NFKB1, NOS2, PCDHB2, RAB7A, RPS6KA1, RRNAD1, TLE6, and UBE2H) were found to be closely related to the clinicopathology and prognosis of colorectal cancer. This study not only suggests the potential value of m6A-related genes as novel prognostic biomarkers for colorectal cancer, but also provides important clues for the diagnosis and treatment of colorectal cancer patients.
Figures
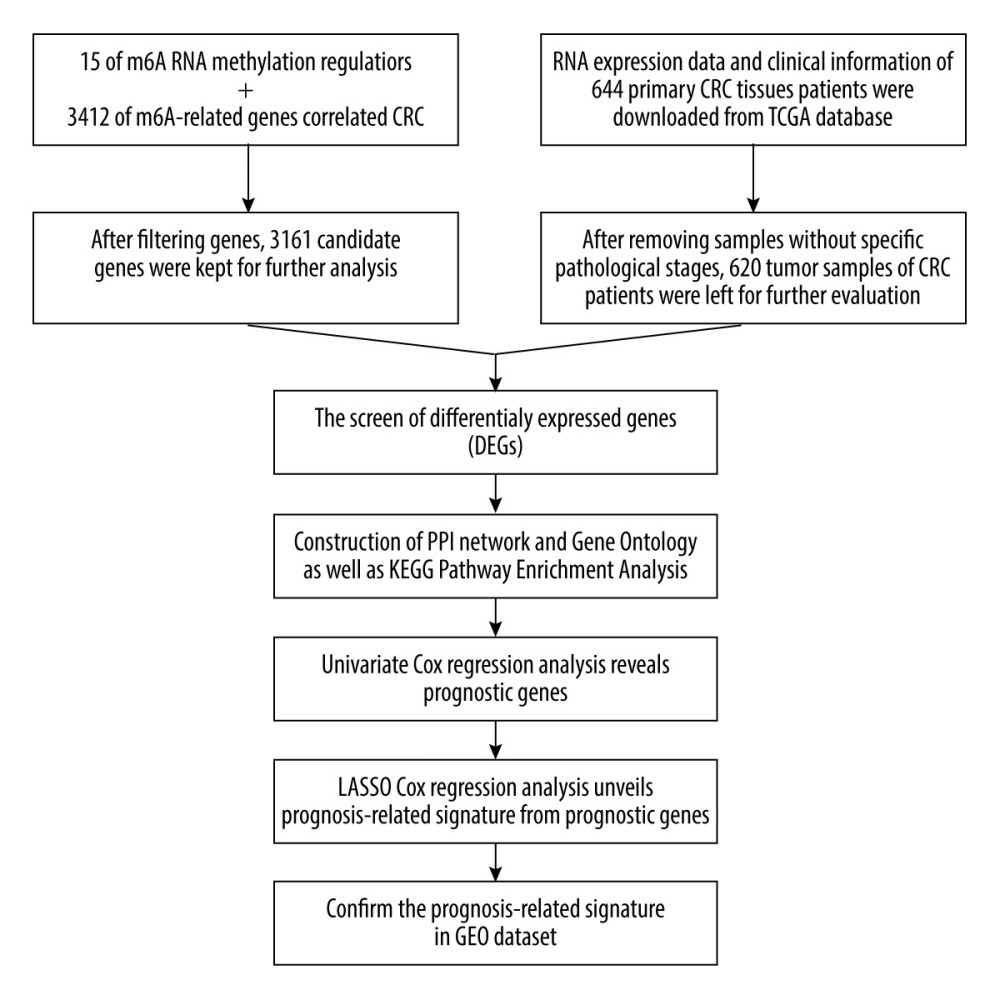 Figure 1. The workflow of this study.
 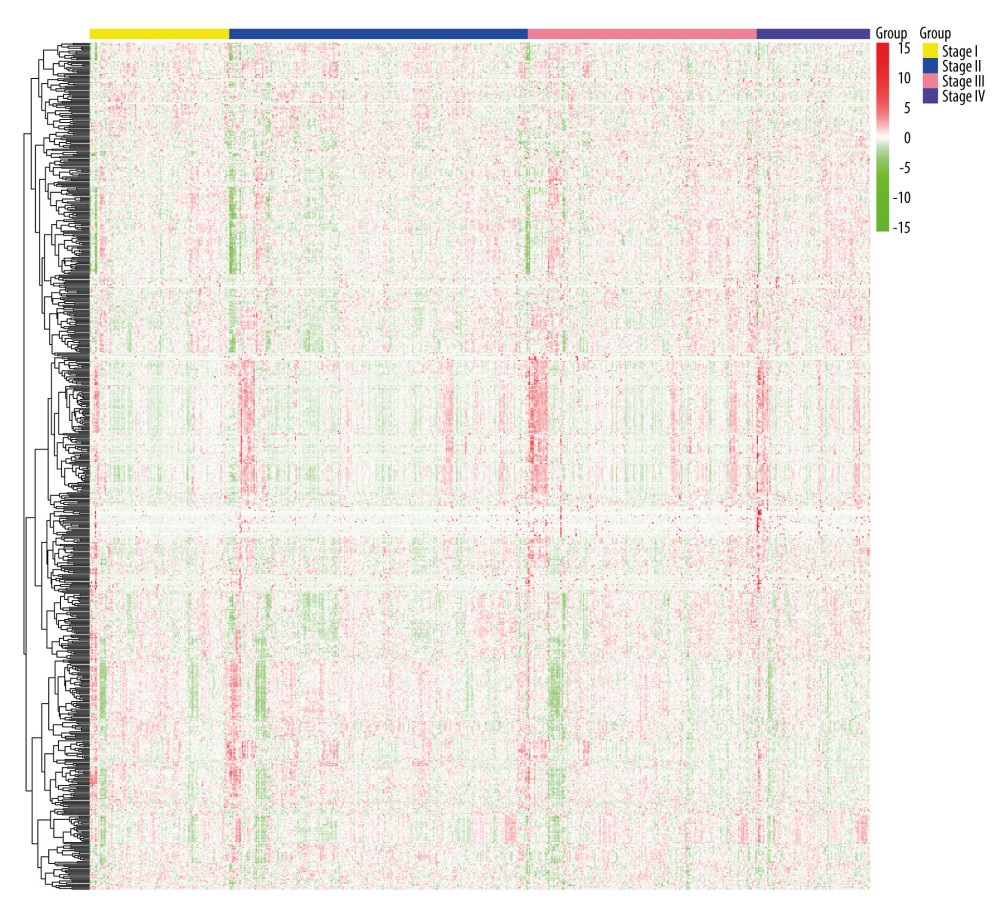 Figure 2. Heatmaps of 673 m6A-related DEGs from patients at different pathological stages. It was plotted using R package pheatmap (V1.0.12).
 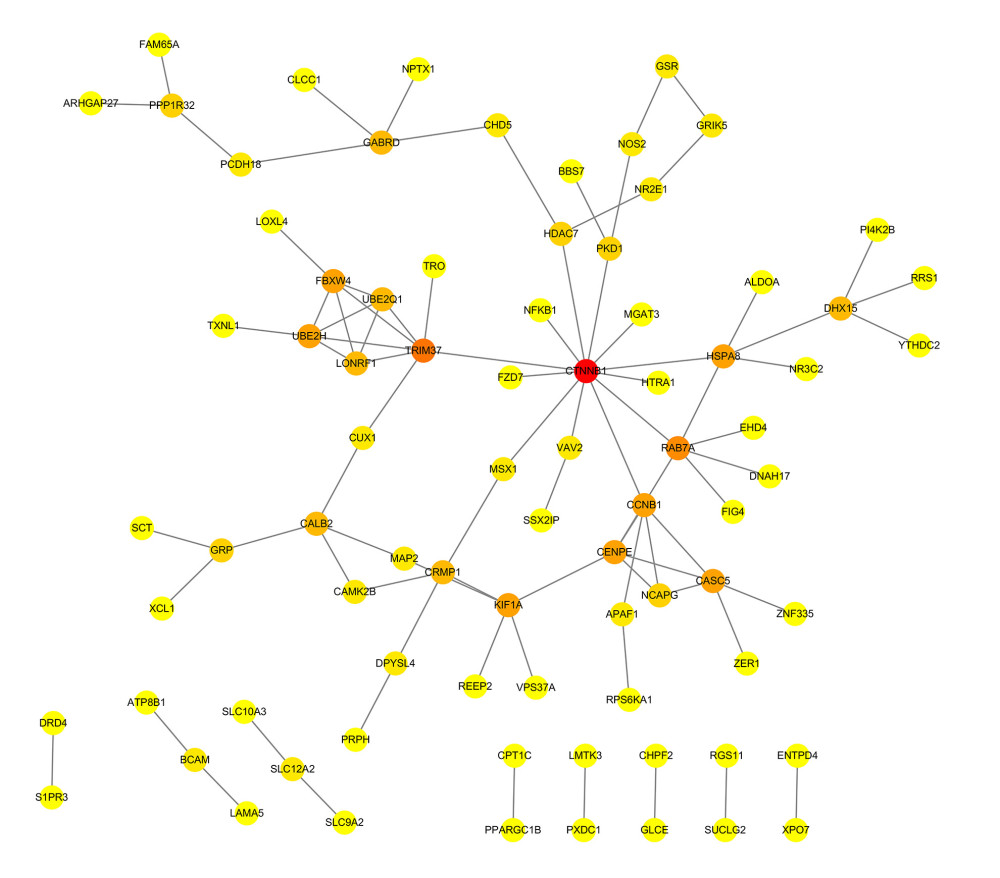 Figure 3. PPI network of prognostic m6A-related genes constructed using STRING database (V11). In the diagram, genes are represented by nodes and their interactions are linked by lines. Genes with red color and large circle had higher degree values in the network, while genes with yellow color and small circle had lower degrees in the network. Cytoscape software (V3.5) was applied to visualize and analyze biological networks and node degrees of the 146 candidate genes.
 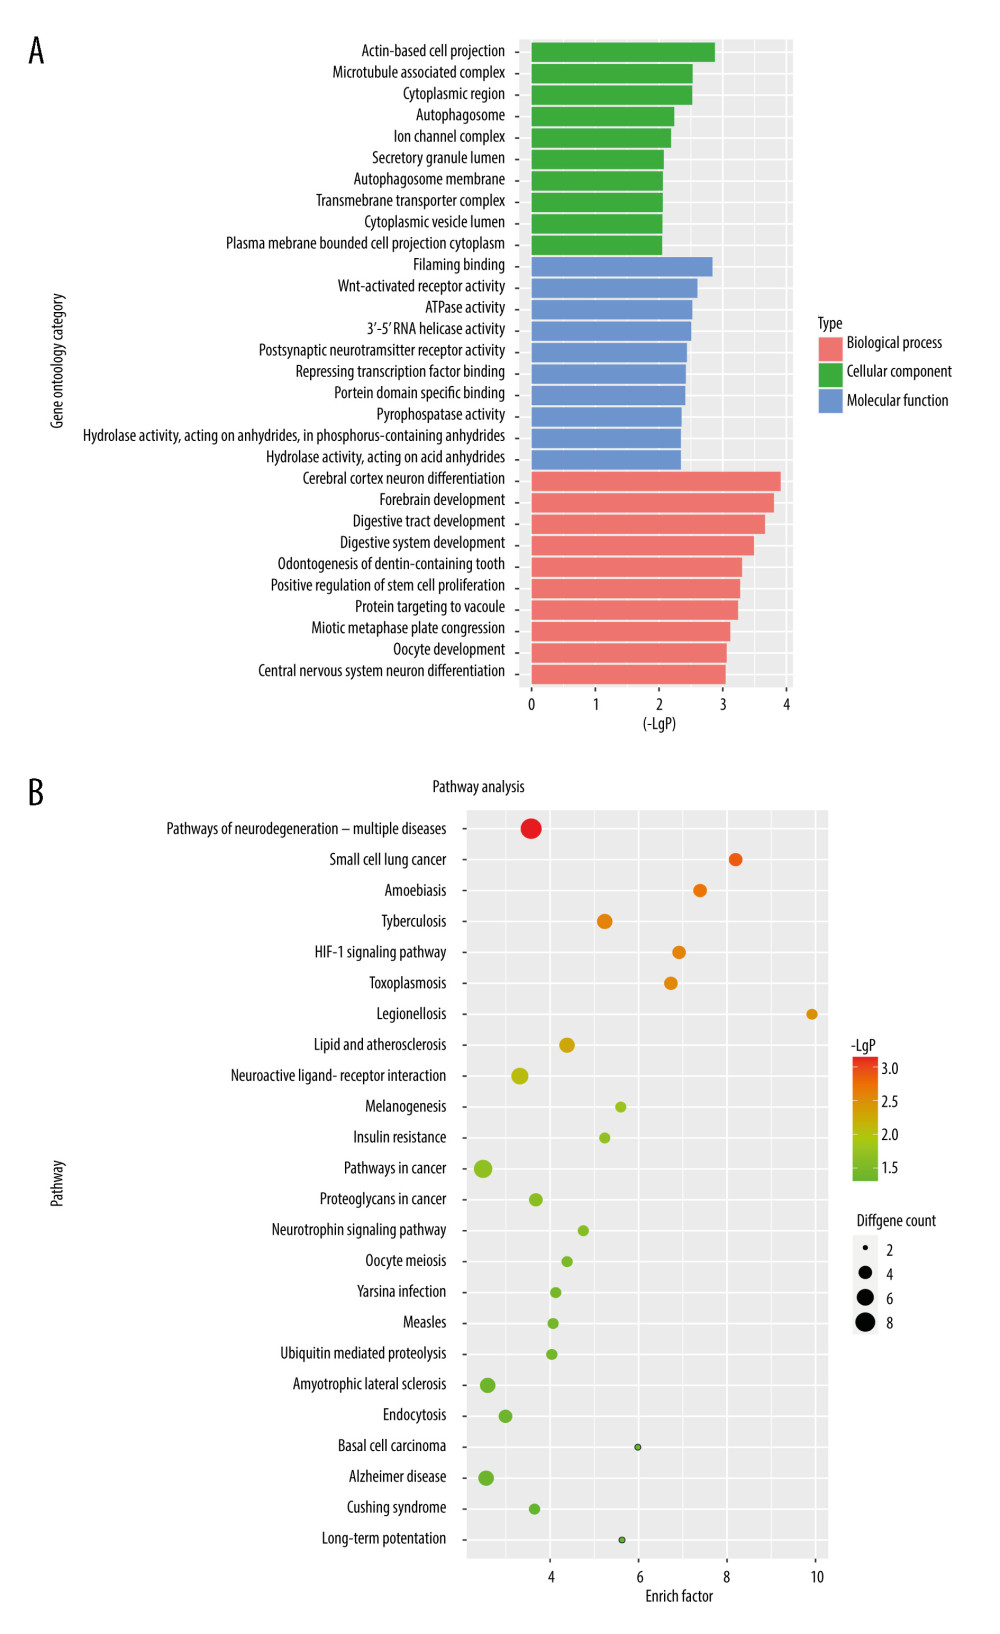 Figure 4. (A, B) Gene Ontology functional annotation and KEGG enrichment of m6A-related DEGs. GO functional annotation and KEGG pathway enrichment analyses of DEGs were performed by R package clusterProfiler (V3.14.3).
 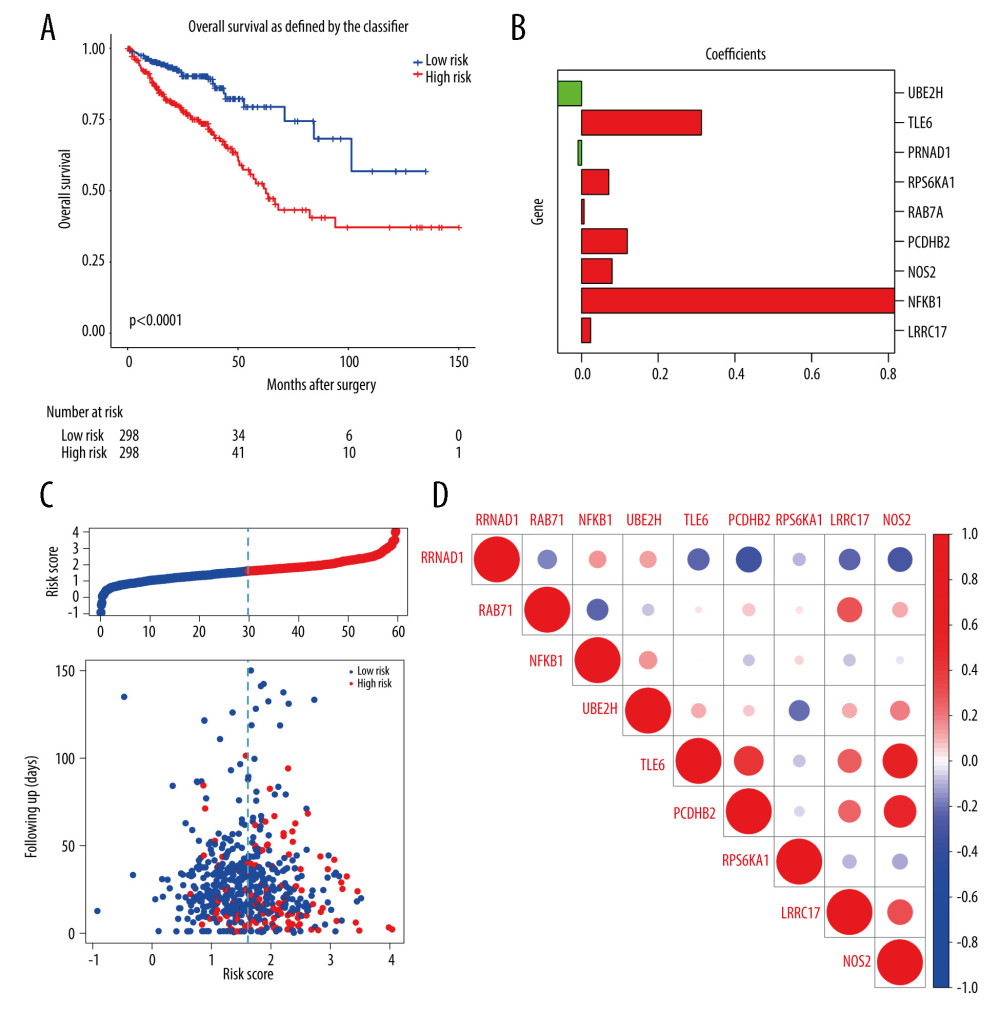 Figure 5. The construction of m6A-related prognostic risk model. (A) The Kaplan-Meier survival curve describes a significant survival difference between the high-risk and low-risk groups in the prognostic model. (B) The coefficient of each selected maker. (C) The risk score curve of CRC patients and the survival status and survival time distribution according to the risk score. (D) Correlations among the 9 maker genes.
 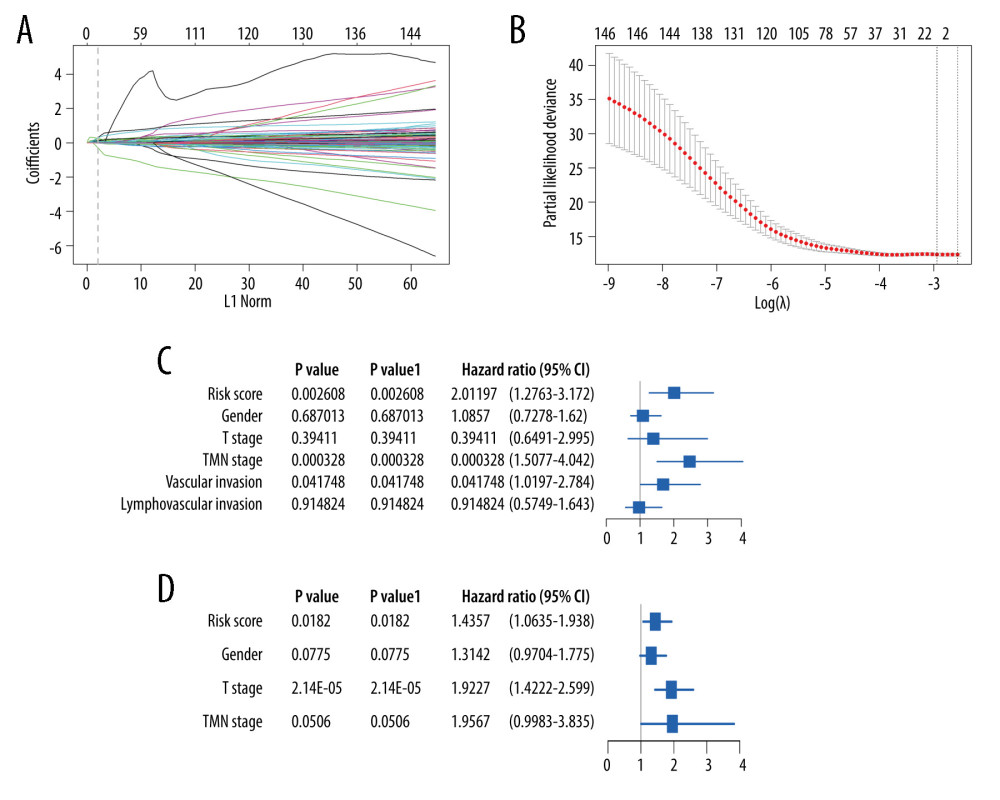 Figure 6. Lasso-Cox regression and multivariate Cox regression analysis of prognostic m6A-related genes. (A, B) 9 m6A-related prognostic genes were screened by LASSO-Cox regression analysis and random permutation. (C, D) The hazard ration (HR) and P values of the training set (TCGA) and the validation set (GSE39582) were calculated by multivariate Cox regression. LASSO-Cox regression analysis to construct the prognostic model of these m6A-related genes with R package glmnet (V4.1).
 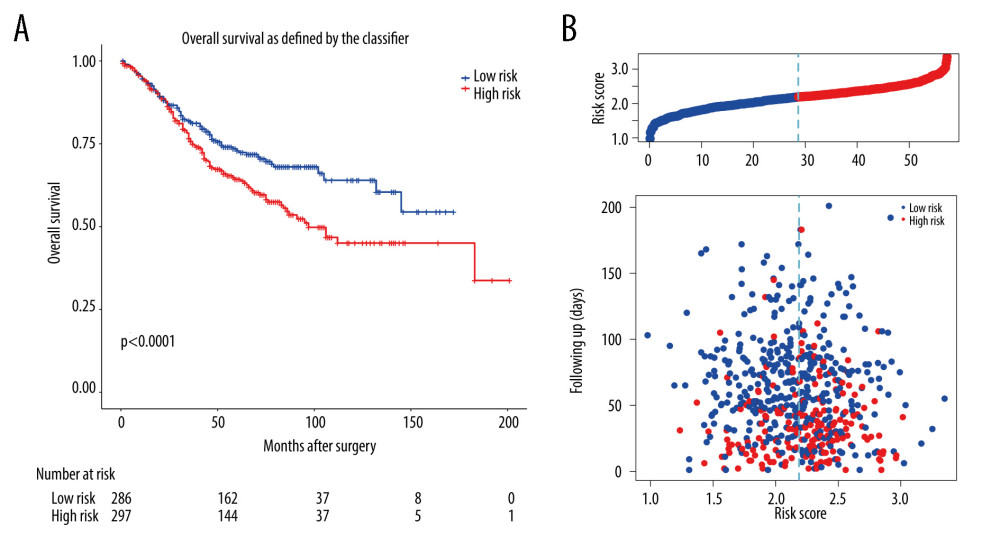 Figure 7. The validation of constructed prognostic model using GEO dataset. (A) The Kaplan-Meier survival curve describes a significant survival difference between the high-risk and low-risk groups in the prognostic model. (B) The risk score curve of CRC patients in GSE39582 and the survival status and survival time distribution according to the risk score.
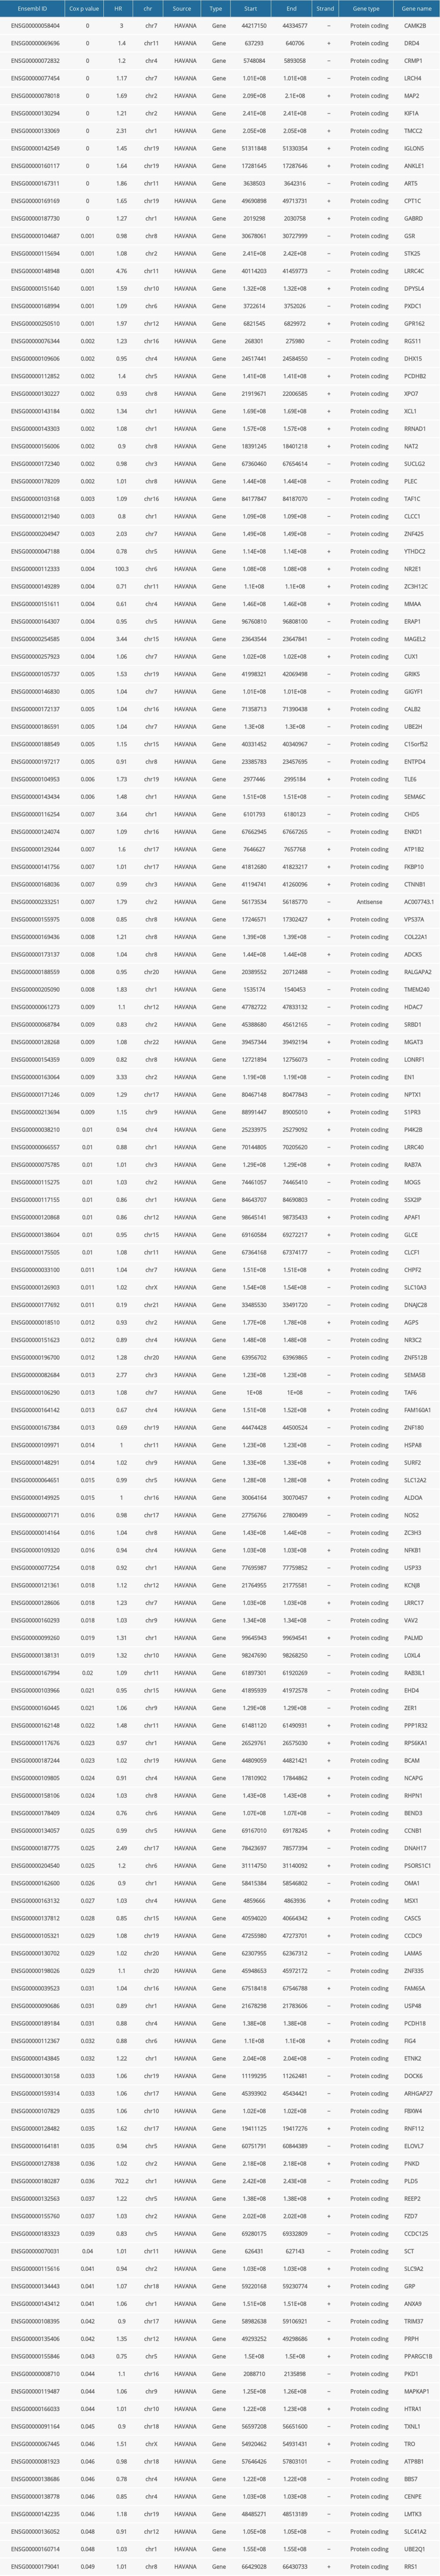
References
1. Sung H, Ferlay J, Siegel RL, Global cancer statistics 2020: GLOBOCAN estimates of incidence and mortality worldwide for 36 cancers in 185 countries: Cancer J Clin, 2021; 73(3); 209-49
2. Rawla P, Sunkara T, Barsouk A, Epidemiology of colorectal cancer: Incidence, mortality, survival, and risk factors: Prz Gastroenterol, 2019; 14(2); 89-103
3. Arnold M, Sierra MS, Laversanne M, Global patterns and trends in colorectal cancer incidence and mortality: Gut, 2017; 66(4); 683-91
4. Sorbye H, Recurrence patterns after resection of liver metastases from colorectal cancer: Recent Results Cancer Res, 2014; 203; 243-52
5. Boccaletto P, Machnicka MA, Purta E, MODOMICS: A database of RNA modification pathways. 2017 update: Nucleic Acids Res, 2018; 46(D1); D303-7
6. Desrosiers R, Friderici K, Rottman F, Identification of methylated nucleosides in messenger RNA from Novikoff hepatoma cells: Proc Natl Acad Sci USA, 1974; 71(10); 3971-75
7. Shi H, Wei J, He C, Where, when, and how: Context-dependent functions of RNA methylation writers, readers, and erasers: Mol Cell, 2019; 74(4); 640-50
8. Niu Y, Zhao X, Wu YS, N6-methyl-adenosine (m6A) in RNA: An old modification with a novel epigenetic function: Genom Proteom Bioinf, 2013; 11(1); 8-17
9. Yang Y, Hsu PJ, Chen YS, Dynamic transcriptomic m6A decoration: Writers, erasers, readers and functions in RNA metabolism: Cell Res, 2018; 28(6); 616-24
10. Barbieri I, Kouzarides T, Role of RNA modifications in cancer: Nat Rev Cancer, 2020; 20(6); 303-22
11. Sun T, Wu R, Ming L, The role of m6A RNA methylation in cancer: Biomed Pharmacother, 2019; 112; 108613
12. Liu ZX, Li LM, Sun HL, Link between m6A modification and cancers: Front Bioeng Biotechnol, 2018; 6; 89
13. Ma S, Chen C, Ji X, The interplay between m6A RNA methylation and noncoding RNA in cancer: J Hematol Oncol, 2019; 12(1); 121
14. Han J, Wang JZ, Yang X, METTL3 promote tumor proliferation of bladder cancer by accelerating pri-miR221/222 maturation in m6A-dependent manner: Mol Cancer, 2019; 18(1); 110
15. Zhang C, Zhang M, Ge S, Reduced m6A modification predicts malignant phenotypes and augmented Wnt/PI3K-Akt signaling in gastric cancer: Cancer Med, 2019; 8(10); 4766-81
16. Zheng Y, Nie P, Peng D, m6AVar: A database of functional variants involved in m6A modification: Nucleic Acids Res, 2018; 46(D1); D139-45
17. Szklarczyk D, Gable AL, Lyon D, STRING v11: Protein–protein association networks with increased coverage, supporting functional discovery in genome-wide experimental datasets: Nucleic Acids Res, 2019; 47(D1); D607-13
18. Shannon P, Markiel A, Ozier O, Cytoscape: A software environment for integrated models of biomolecular interaction networks: Genome Res, 2003; 13(11); 2498-504
19. Ashburner M, Ball CA, Blake JA, Gene ontology: Tool for the unification of biology. The Gene Ontology Consortium: Nat Genet, 2000; 25(1); 25-29
20. The Gene Ontology Consortium, The Gene Ontology resource: 20 years and still GOing strong: Nucleic Acids Res, 2019; 47(D1); D330-38
21. Kanehisa M, Furumichi M, Tanabe M, KEGG: New perspectives on genomes, pathways, diseases and drugs: Nucleic Acids Res, 2017; 45(D1); D353-61
22. Yu G, Wang LG, Han Y, clusterProfiler: An R package for comparing biological themes among gene clusters: OMICS, 2012; 16(5); 284-87
23. Friedman J, Hastie T, Tibshirani R, Regularization paths for generalized linear models via coordinate descent: J Stat Softw, 2010; 33(1); 1-22
24. Simon N, Friedman J, Hastie T, Tibshirani R, Regularization paths for Cox’s proportional hazards model via coordinate descent: J Stat Softw, 2011; 39(5); 1-13
25. Tibshirani R, Bien J, Friedman J, Strong rules for discarding predictors in lasso-type problems: J R Stat Soc Series B Stat Methodol, 2012; 74(2); 245-66
26. Therneau TM, Grambsch PM: The Cox model” Modeling survival data: Extending the Cox model, 2000; 39-77, New York, NY, Springer
27. Alboukadel K, Kosinski M, Biecek P: survminer: Drawing Survival Curves using ‘ggplot2’, 2021 package version 0.4.9
28. Wurth L, Papasaikas P, Olmeda D, UNR/CSDE1 Drives a post-transcriptional program to promote melanoma invasion and metastasis: Cancer Cell, 2016; 30(5); 694-707
29. Martinez-Useros J, Georgiev-Hristov T, Fernández-Aceñero MJ, UNR/CDSE1 expression as prognosis biomarker in resectable pancreatic ductal adenocarcinoma patients: A proof-of-concept: PLoS One, 2017; 12(8); e0182044
30. Yang Z, Li J, Feng G, MicroRNA-145 modulates N6-methyladenosine levels by targeting the 3′-untranslated mRNA region of the N6-methyladenosine binding YTH domain family 2 protein: J Biol Chem, 2017; 292(9); 3614-23
31. Liu T, Wei Q, Jin J, The m6A reader YTHDF1 promotes ovarian cancer progression via augmenting EIF3C translation: Nucleic Acids Res, 2020; 48(7); 3816-31
32. Zhang Q, Cai Y, Kurbatov V, Gene alterations of N6-methyladenosine (m6A) regulators in colorectal cancer: A TCGA database study: Biomed Res Int, 2020; 2020; 8826456
33. Xu D, Shao J, Song H, Wang J, The YTH domain damily of N6-methyladenosine “readers” in the diagnosis and prognosis of colonic adenocarcinoma: Biomed Res Int, 2020; 2020; 9502560
34. Liu X, Liu L, Dong Z, Expression patterns and prognostic value of m6A-related genes in colorectal cancer: Am J Transl Res, 2019; 11(7); 3972-91
35. Liu L, Wang J, Sun G, m6A mRNA methylation regulates CTNNB1 to promote the proliferation of hepatoblastoma: Mol Cancer, 2019; 18(1); 188
36. Liu X, Su K, Sun X, Sec62 promotes stemness and chemoresistance of human colorectal cancer through activating Wnt/β-catenin pathway: J Exp Clin Cancer Res, 2021; 40(1); 132
37. Guerrero-Preston R, Hadar T, Ostrow KL, Differential promoter methylation of kinesin family member 1a in plasma is associated with breast cancer and DNA repair capacity: Oncol Rep, 2014; 32(2); 505-12
38. Zhang H, Zhang X, Li X, Effect of CCNB1 silencing on cell cycle, senescence, and apoptosis through the p53 signaling pathway in pancreatic cancer: J Cell Physiol, 2018; 234(1); 619-31
39. Li T, Gu M, Deng A, Increased expression of YTHDF1 and HNRNPA2B1 as potent biomarkers for melanoma: A systematic analysis: Cancer Cell Int, 2020; 20; 239
40. Gu X, Jiang Y, Xue W, SPNS2 promotes the malignancy of colorectal cancer cells via regulating Akt and ERK pathway: Clin Exp Pharmacol Physiol, 2019; 46(9); 861-71
41. Zhao M, Liu Q, Gong Y, GSH-dependent antioxidant defense contributes to the acclimation of colon cancer cells to acidic microenvironment: Cell Cycle, 2016; 15(8); 1125-33
Figures
Figure 1. The workflow of this study.Figure 2. Heatmaps of 673 m6A-related DEGs from patients at different pathological stages. It was plotted using R package pheatmap (V1.0.12).Figure 3. PPI network of prognostic m6A-related genes constructed using STRING database (V11). In the diagram, genes are represented by nodes and their interactions are linked by lines. Genes with red color and large circle had higher degree values in the network, while genes with yellow color and small circle had lower degrees in the network. Cytoscape software (V3.5) was applied to visualize and analyze biological networks and node degrees of the 146 candidate genes.Figure 4. (A, B) Gene Ontology functional annotation and KEGG enrichment of m6A-related DEGs. GO functional annotation and KEGG pathway enrichment analyses of DEGs were performed by R package clusterProfiler (V3.14.3).Figure 5. The construction of m6A-related prognostic risk model. (A) The Kaplan-Meier survival curve describes a significant survival difference between the high-risk and low-risk groups in the prognostic model. (B) The coefficient of each selected maker. (C) The risk score curve of CRC patients and the survival status and survival time distribution according to the risk score. (D) Correlations among the 9 maker genes.Figure 6. Lasso-Cox regression and multivariate Cox regression analysis of prognostic m6A-related genes. (A, B) 9 m6A-related prognostic genes were screened by LASSO-Cox regression analysis and random permutation. (C, D) The hazard ration (HR) and P values of the training set (TCGA) and the validation set (GSE39582) were calculated by multivariate Cox regression. LASSO-Cox regression analysis to construct the prognostic model of these m6A-related genes with R package glmnet (V4.1).Figure 7. The validation of constructed prognostic model using GEO dataset. (A) The Kaplan-Meier survival curve describes a significant survival difference between the high-risk and low-risk groups in the prognostic model. (B) The risk score curve of CRC patients in GSE39582 and the survival status and survival time distribution according to the risk score. In Press
05 Mar 2024 : Clinical Research
Muscular Function Recovery from General Anesthesia in 132 Patients Undergoing Surgery with Acceleromyograph...Med Sci Monit In Press; DOI: 10.12659/MSM.942780
05 Mar 2024 : Clinical Research
Effects of Thermal Insulation on Recovery and Comfort of Patients Undergoing Holmium Laser LithotripsyMed Sci Monit In Press; DOI: 10.12659/MSM.942836
05 Mar 2024 : Clinical Research
Role of Critical Shoulder Angle in Degenerative Type Rotator Cuff Tears: A Turkish Cohort StudyMed Sci Monit In Press; DOI: 10.12659/MSM.943703
06 Mar 2024 : Clinical Research
Comparison of Outcomes between Single-Level and Double-Level Corpectomy in Thoracolumbar Reconstruction: A ...Med Sci Monit In Press; DOI: 10.12659/MSM.943797
Most Viewed Current Articles
17 Jan 2024 : Review article
Vaccination Guidelines for Pregnant Women: Addressing COVID-19 and the Omicron VariantDOI :10.12659/MSM.942799
Med Sci Monit 2024; 30:e942799
14 Dec 2022 : Clinical Research
Prevalence and Variability of Allergen-Specific Immunoglobulin E in Patients with Elevated Tryptase LevelsDOI :10.12659/MSM.937990
Med Sci Monit 2022; 28:e937990
16 May 2023 : Clinical Research
Electrophysiological Testing for an Auditory Processing Disorder and Reading Performance in 54 School Stude...DOI :10.12659/MSM.940387
Med Sci Monit 2023; 29:e940387
01 Jan 2022 : Editorial
Editorial: Current Status of Oral Antiviral Drug Treatments for SARS-CoV-2 Infection in Non-Hospitalized Pa...DOI :10.12659/MSM.935952
Med Sci Monit 2022; 28:e935952