01 November 2021: Database Analysis
Identification of Potential Prognostic and Predictive Biomarkers for Immune-Checkpoint Inhibitor Response in Small Cell Lung Cancer
Chanchan Gao1E, Xuyu Gu1A*, Yan Chen1C, Min Zhou1D, Feng Jiang1F, Shiya Zheng1GDOI: 10.12659/MSM.932275
Med Sci Monit 2021; 27:e932275


Abstract
BACKGROUND: Immune-checkpoint inhibitors have propelled the field of therapeutics for small cell lung cancer (SCLC) treatment, but are only beneficial to some patients. The objective of this study was to identify valid biomarkers for good potential response to immunotherapy.
MATERIAL AND METHODS: We performed an integrated analysis of the available datasets from the Gene Expression Omnibus (GEO) projects, Cancer Cell Line Encyclopedia (CCLE), TISIDB database, and Lung Cancer Explorer (LCE) database. Six prognosis-related genes (MCM2, EZH2, CENPK, CHEK1, CDKN2A, and EXOSC2) were identified utilizing the meta workflow of data analysis methods. We performed subclass mapping to compare their expression profiles to other datasets of patients who responded to immunotherapy. A drug sensitivity predictive model was used to predict the chemotherapeutic response to cisplatin and etoposide.
RESULTS: Our results showed that the expression of the 6 key genes was significantly associated with the overall survival of patients with SCLC. Lower expression of these 6 genes was correlated to the response to anti-PD-1 treatment. Additionally, low expression of MCM2, EZH2, CENPK, and CHEK1 was correlated with increased sensitivity to cisplatin, but not etoposide.
CONCLUSIONS: Overall, our data showed that MCM2, EZH2, CENPK, CHEK1, CDKN2A, and EXOSC2 are potential prognostic and predictive biomarkers for response to immune-checkpoint inhibitor treatment in patients with SCLC. Further studies with large sample sizes are required to validate our findings and to explore the detailed mechanisms underlying the role of these genes in SCLC.
Keywords: Antineoplastic Agents, Immunological, Antineoplastic Combined Chemotherapy Protocols, Small Cell Lung Carcinoma, Biomarkers, Tumor, Cohort Studies, Humans, Immune Checkpoint Inhibitors, Immunotherapy
Background
Small cell lung cancer (SCLC) is one of the deadliest and most aggressive lung cancers due to its rapid growth, early metastasis, and acquired therapeutic resistance [1]. Unlike non-small cell lung cancer (NSCLC), which can be treated with a plethora of drugs, few treatment options are available for patients with SCLC. The current standard of care, which was defined several decades ago [2], relies on platinum-based chemotherapy and has a median survival time of only 8–13 months [3].
However, the treatment landscape has recently changed with the introduction of immune-checkpoint inhibitors (ICIs). Incorporation of the anti-PDL1 antibody atezolizumab with platinum-doublet chemotherapy has become the first-line therapy for extensive SCLC, with an improvement in median overall survival (OS) from 10.3 to 12 months for patients with metastatic disease [4]. Ipilimumab (an anti-CTLA4 monoclonal antibody) also showed increased survival in a phase II trial [5].
Unfortunately, only a subset of patients with SCLC benefits from immunotherapy [4]. More recent studies have reported the use of drugs such as CheckMate-032 and CheckMate-331 for maintenance and second-line therapy, but these fail to improve survival for patients with SCLC [6,7]. Recent research suggest that high tumor mutational burden (TMB) may be correlated with efficacy of immunotherapy in SCLC [8]. Moreover, no study used genetic marker to select patients more likely to benefit from these treatments, which may explain their clinical failure. Therefore, there is an urgent need to identify biomarkers that can predict the responsiveness to immune-checkpoint blockade treatment.
To address this, we analyzed the expression of different genes in healthy and tumor tissues from patients with SCLC in 2 independent cohorts. We then identified genes associated with immunotherapeutic response. Using subclass mapping and survival analysis, we found 6 prognostic genes predictive for response to immune-checkpoint inhibitors. These results were validated by meta-analysis and a third cohort (a summary of the statistical analysis is presented in Figure 1).
Material and Methods
DATA AND RESOURCES:
We used 3 different cohorts for this study. Expression data for the first 2 cohorts were downloaded from the Gene Expression Omnibus (GEO) database (http://www.ncbi.nlm.nih.gov/geo) [9]. The first cohort was obtained from the Affymetrix U133plus2 GEO SCLC Cohort (accession number GSE43346) and comprised 42 normal samples and 23 clinical SCLC samples. The second cohort downloaded from GEO (accession number GSE60052) consisted of 7 normal lung samples and 79 SCLC samples, of which only 48 had associated clinical data. Gene expression profiles were obtained using the Illumina HiSeq2000 platform. The third cohort was downloaded from the Cancer Cell Line Encyclopedia (CCLE) database (https://portals.broadinstitute.org/ccle) [10]. The CCLE datasets contain information from cell lines derived from different tumor types; we used data from SCLC tumors, resulting in 51 samples for this cohort.
Additionally, we analyzed a comprehensive list of 5826 immunotherapy-related genes available from the Tumor-Immune System Interactions Database (TISIDB) (http://cis.hku.hk/TISIDB/) [11]. These genes are known to differ in expression between patients that are responders vs those who are non-responders to immunotherapy.
IDENTIFICATION OF DIFFERENTIALLY EXPRESSED GENES RELATED TO IMMUNOTHERAPY:
We identified differentially expressed genes (DEGs) by comparing the normalized expression data of SCLC samples to that of normal samples from GSE43346 and GSE60052. Only DEGs with |log2FC| >2 and FDR <0.05 were extracted using the Limma package in R [12]. We calculated the difference between the 2 groups using the t test and adjusted the P value using the Benjamini-Hochberg (BH) method. To identify immunotherapy-related genes among the SCLC DEGs, Venn analysis was utilized to determine overlapping DEGs among the 2 GEO datasets and the TISIDB dataset above. To narrow the scope of candidate genes, we selected the top 300 DEGs, in ascending order of FDR, from each GEO dataset.
FUNCTIONAL ENRICHMENT ANALYSIS AND PPI NETWORK CONSTRUCTION:
We conducted function and protein-protein interaction (PPI) enrichment analyses to predict the biological function of the aforementioned DEGs using Metascape online tools (http://metascape.org/gp/index.html#/main/step1) [13]. The DEGs were annotated according to gene ontology biological processes. The P value was set at <0.01, indicating a statistically significant enrichment score of the GO or pathway terms. The PPI network was also visualized by Metascape.
SURVIVAL ANALYSIS:
Fifty-five patients (48 SCLC samples and 7 normal lung samples) from GSE60052 were divided into high- and low-expression groups based on optimal cut-off values defined by R package “Survminer” [14] for candidate gene expression. We used Kaplan-Meier survival curves to show the differences in patients’ OS between the high and low expression groups. Genes with P values <0.05 were identified as prognosis-related genes.
IMMUNOTHERAPEUTIC/CHEMOTHERAPEUTIC RESPONSE PREDICTION:
We divided the expression profiles from GSE60052 (n=86) into high- and low-expression groups based on the median expression values of our key genes. We further utilized an unsupervised subclass mapping (https://cloud.genepattern.org/gp/) to compare these expression profiles with those of another dataset containing 47 patients with melanoma who responded to immunotherapy [15,16] to predict the response to ICI therapy in high- and low-subgroup. R package “pheatmap” was used for visualizing the results. We also analyzed the expression profiles of SCLC cell lines (n=51) from the CCLE database using the same method to validate the immunotherapeutic response prediction. Groups with Bonferroni-corrected P values <0.05 were identified as immunotherapy responders.
In addition to the immunotherapeutic response prediction, the chemotherapeutic response for 86 samples was predicted using the Genomics of Drug Sensitivity in Cancer database (GDSC) (https://www.cancerrxgene.org/) [17]. We predicted the responses to cisplatin and etoposide using the pRRophetic package in R [18]. Each sample’s half-maximal inhibitory concentration (IC50) was assessed by ridge regression, and the prediction accuracy was evaluated by 10-fold cross-validation relying on the GDSC training model. We summarized duplicate gene expression as the mean expression, and set the tissue type to “allSolidTumours” and the batch effect to “combat”. Meanwhile, the values of other parameters were set as default.
SURVIVAL META-ANALYSIS OF KEY HENES:
Using survival meta-analysis on data from the Lung Cancer Explorer (LCE) database (http://lce.biohpc.swmed.edu/lungcancer/) [19], we were able to validate whether our chosen key genes were prognosis-related in SCLC based on the meta-analysis module in LCE database. Survival meta-analysis was based on 56 studies, including over 6700 patients with lung cancer. Cox hazard models were fitted to evaluate the association between key genes expression and patient survival outcome in each dataset. After heterogeneity testing, the HR from individual datasets were then calculated to summary HR utilizing a random effects model.
STATISTICAL AND BIOINFORMATIC ANALYSIS:
The
Results
IDENTIFICATION OF CANDIDATE GENES RELATED TO IMMUNOTHERAPY:
To select genes differentially expressed between SCLC and normal tissues, we conducted Limma analysis of data from GSE43346 and GSE60052. We identified 2951 and 3365 DEGs from each dataset, respectively, and the 2 datasets had 777 DEGs in common (co-DEGs). We then identified common genes between these co-DEGS and the immunotherapy-related genes from TISIDB, which included DEGs between immunotherapy responders and non-responders, resulting in 443 candidate genes retained for further analysis (Figure 2A).
To obtain further insight into their function, the candidate genes were uploaded to the Metascape database. GO and KEGG (Gene Ontology and Kyoto Encyclopedia of Genes and Genomes) analysis results showed that the candidate genes were mainly enriched through mitotic nuclear division, chromosome segregation, nuclear division, organelle fission, nuclear chromosome segregation, and regulation of chromosome segregation. Moreover, candidate genes for organelle fission were significantly enriched (Figure 2B).
Using the Metascape database, we also constructed PPI networks selecting samples that had a PPI minimum network size above 3. From these constructed PPI networks, we identified closely related proteins using molecular complex detection (MCODE). The candidate genes in the PPI networks were stratified into 11 subclusters through the MCODE algorithm. Figure 2C shows MCODE components.
KEY GENES AS PROGNOSTIC BIOMARKERS:
The prognostic importance of the 11 selected genes modulated in SCLC was evaluated using the GSE60052 clinical data, from which we retrieved 55 SCLC patient samples with clinical data. The gene expression values were categorized as high or low according to the optimal cut-off values set by the Survminer package for R. As a result, 6 genes were found to be independent prognostic factors for OS. Low expression of enhancer of zeste homolog 2 (EZH2) was associated with poor OS (P=0.049), whereas high expression of minichromosome maintenance complex component 2 (MCM2) (P=0.031), cyclin-dependent kinase inhibitor 2A (CDKN2A) (p=.008), centromere protein K (CENPK) (P<0.001), checkpoint kinase 1 (CHEK1) (P=0.001), and exosome component 2 (EXOSC2) (P=0.031) were associated with poor OS (Figure 3A). The heatmap showed that the expression level of 6 genes is lower in the normal tissue (Figure 3B). Moreover, the correlation heatmap showed a significant positive correlation among the 6 genes (Figure 3C).
KEY GENES AS PREDICTIVE BIOMARKERS OF IMMUNOTHERAPEUTIC/CHEMOTHERAPEUTIC RESPONSE:
We subsequently performed a SubClass Mapping (SubMap) analysis to determine whether groups with high and low expression of these key genes were similar to other groups that clearly responded to immunotherapy [15]. SubMap results indeed showed that low expression of the 6 key genes was correlated with favorable response to anti-PD-1 treatment CDKN2A (Bonferroni-corrected P=0.008), CENPK (Bonferroni-corrected P=0.007), CHEK1 (Bonferroni-corrected P=0.023), EXOSC2 (Bonferroni-corrected P=0.001), EZH2 (Bonferroni-corrected P=0.031), and MCM2 (Bonferroni-corrected P=0.008). Moreover, lower expression of EXOSC2 was correlated with more favorable response to anti-CTLA4 treatment (Bonferroni-corrected p=0.039) (Figure 4).
Because chemotherapy is the standard of care for SCLC, we assessed the GDSC data for chemotherapeutic responses to cisplatin and etoposide based on a predictive model. The estimated IC50 of cisplatin, but not of etoposide, significantly differed between the high- and low-expression groups. Low expression of MCM2 (P=0.019), EZH2 (p=0.0008), CENPK (P=0.008), and CHEK1 (P=0.0013) was correlated with favorable cisplatin response, whereas the expression of CDKN2A (p=0.598) and EXOSC2 (P=0.096) was not predictive of chemotherapeutic response. There were no statistically significant differences between the high and low expression groups in terms of predicting response to etoposide (MCM2, P=0.824; EZH2, P=0.473; CENPK, P=0.775; CHEK1, P=0.832; CDKN2A, P=0.993; and EXOSC2, P=0.924). Overall, our results suggest that MCM2, EZH2, CENPK, and CHEK1 are predictive biomarkers for chemotherapeutic response to cisplatin (Figure 5).
VALIDATION OF THE PROGNOSTIC AND PREDICTIVE VALUE OF THE 6 KEY GENES:
To validate the expression of the 6 potential biomarkers for the prognosis of SCLC, we examined their impact on the OS of patients with SCLC. In multiple selected lung cancer studies, we found that the survival meta-analyses for MCM2, EZH2, CENPK, CHEK1, CDKN2A, and EXOSC2 were significant in patients with SCLC (P<0.01). Our results indicate that these 6 genes can predict the prognosis of SCLC (Figure 6).
Finally, we selected 51 SCLC cell lines to validate the ability of our 6 key genes to predict immunotherapeutic response. Using SubMap analysis, we found that low expression of 4 of the 6 genes predicted response to anti-PD-1 therapy (CENPK (Bonferroni-corrected P=0.020), CHEK1 (Bonferroni-corrected P=0.021), and EZH2 (Bonferroni-corrected P=0.048)). Low expression of MCM2, CDKN2A, and EXOSC2 did not significantly predict response (MCM2 Bonferroni-corrected P=0.479, CDKN2A Bonferroni-corrected P=1.000, and EXOSC2 Bonferroni-corrected P= 0.315). Interestingly, the high expression of CENPK predicted response to anti-CTLA4 therapy (CENPK Bonferroni-corrected P=0.030) (Figure 7).
Discussion
The addition of ICIs to chemotherapy regimens for first-line management is a significant advancement in the treatment of patients with SCLC. Predictive biomarkers are crucial to identify patients with SCLC who could benefit from ICIs. Recent studies have shown that TMB could serve as a predictive factor for immunotherapy in SCLC [20]. However, genetic markers that predict ICI response have not been well studied. To the best of our knowledge, this is the first study to assess potential genes that predict response to ICIs in SCLC. In this study, we also assessed chemotherapeutic response in patients with SCLC. Our results revealed that lower expression of 6 key genes (
A limitation of this study is that we did not explore the potential mechanisms of our 6 key genes underlying the response of patients with SCLC to immunotherapy, as all the data analyzed in our study were retrieved from online databases. The prognostic significance of the 6 genes is validated in lung cancers, not specifically in small cell lung cancer. Due to the lack of valid verifying datasets of SCLC, further studies with larger sample sizes are required to validate our findings and to explore the detailed mechanisms of the 6 key genes in SCLC.
Hans et al reported that
To date, little is known about the expression and roles of
Conclusions
In conclusion, our results showed that expression of the 6 key genes was significantly associated with OS of patients with SCLC, and that lower expression of these 6 genes was correlated with response to anti-PD-1 therapy. We also showed that low expression of
Figures
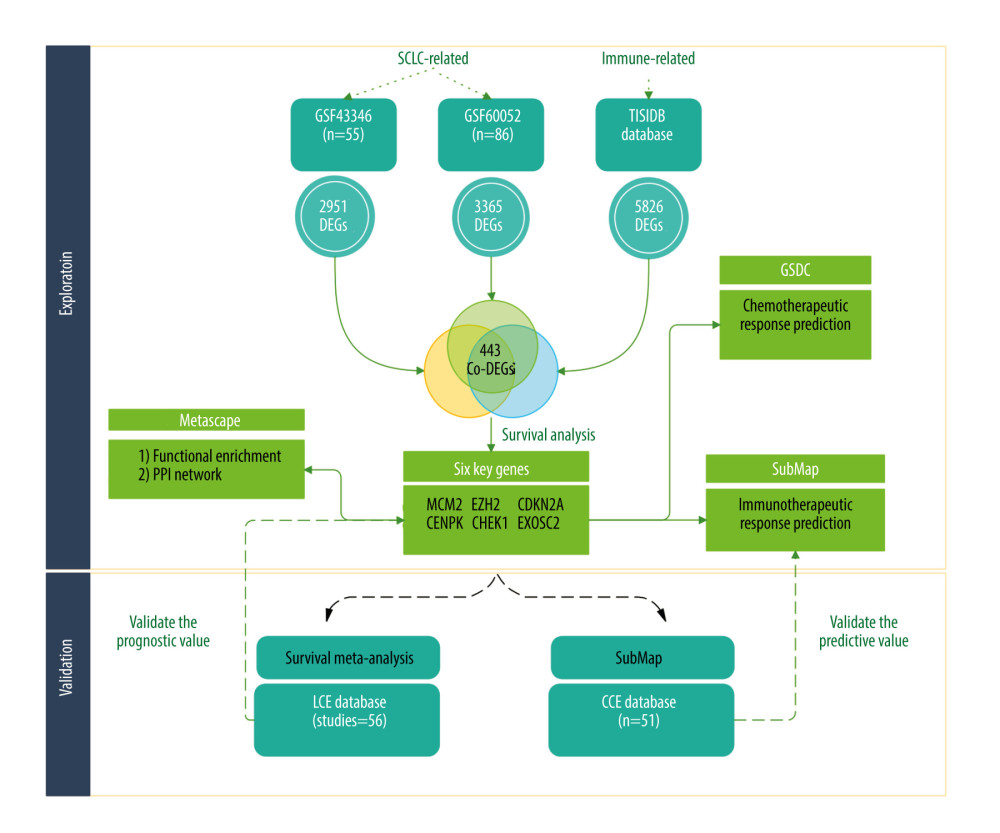 Figure 1. The flowchart of our study (Biorender website, https://biorender.com/).
 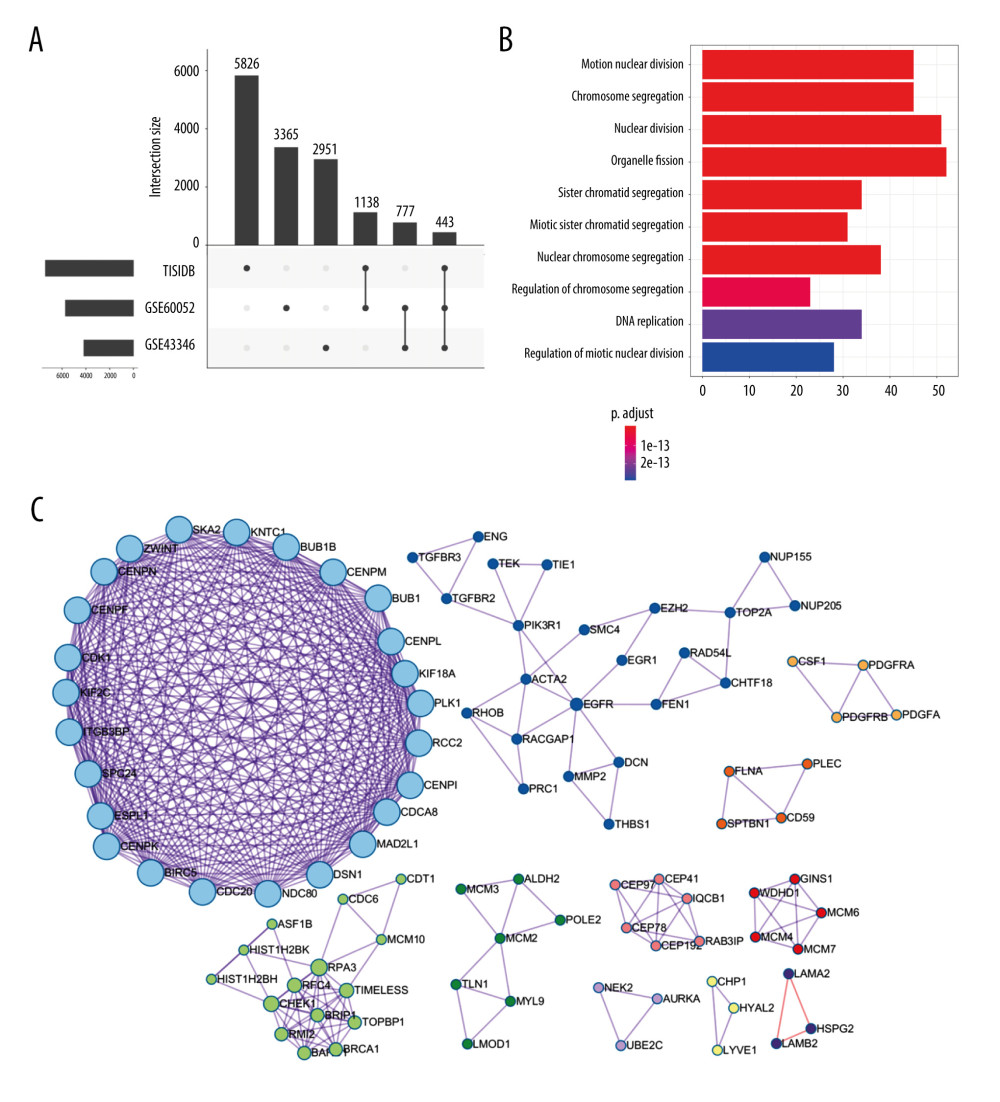 Figure 2. Identification of candidate genes related to immunotherapy. (A) Identification of common differentially expressed genes from 3 datasets. (B) The gene ontology annotation and pathway enrichment analysis of differentially expressed genes. (C) PPI networks and 11 subclusters of differentially expressed genes. R software Version 4.0.0 (http://www.r-project.org) and Metascape online tools http://metascape.org/gp/index.html#/main/step1.
 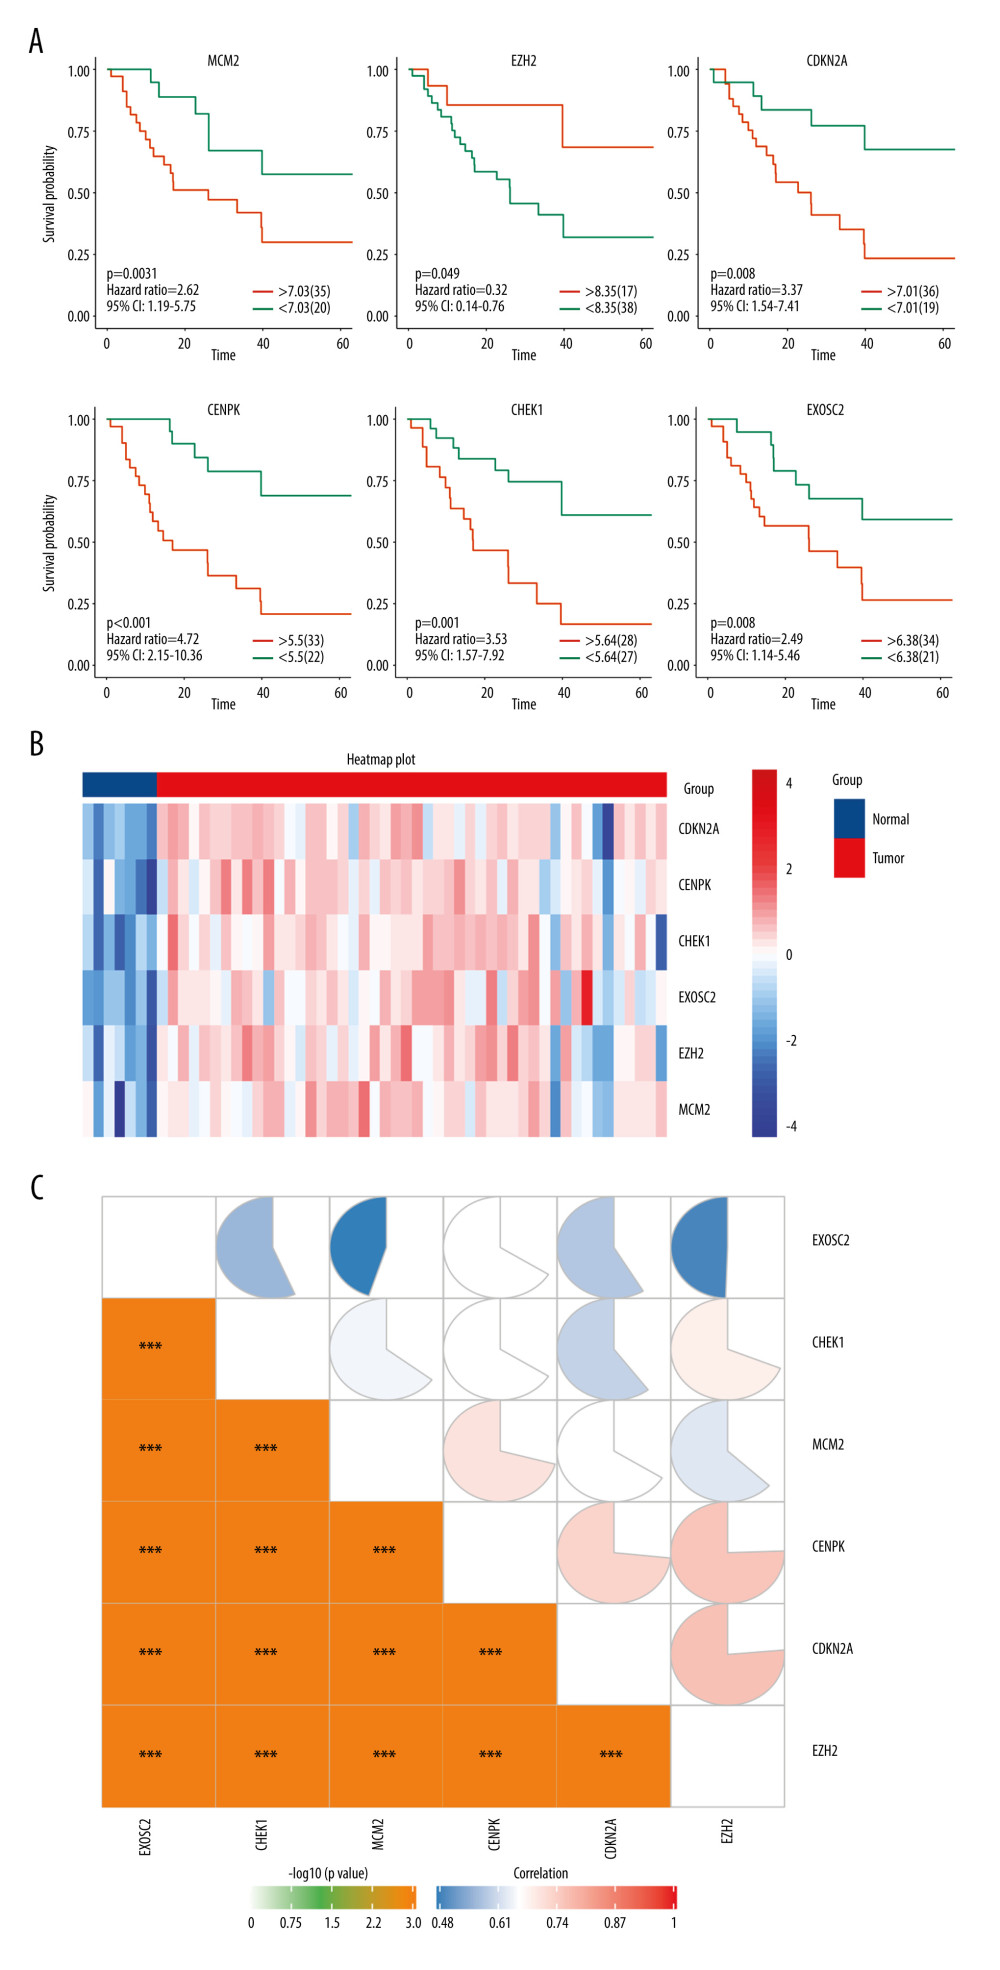 Figure 3. (A) Overall survival according to the expression of the 6 selected genes modulated in SCLC. (B) Heatmap demonstrated the expression level of 6 selected genes between normal and tumor tissue. (C) Correlation heatmap of the 6 selected genes. R software Version 4.0.0 http://www.r-project.org.
 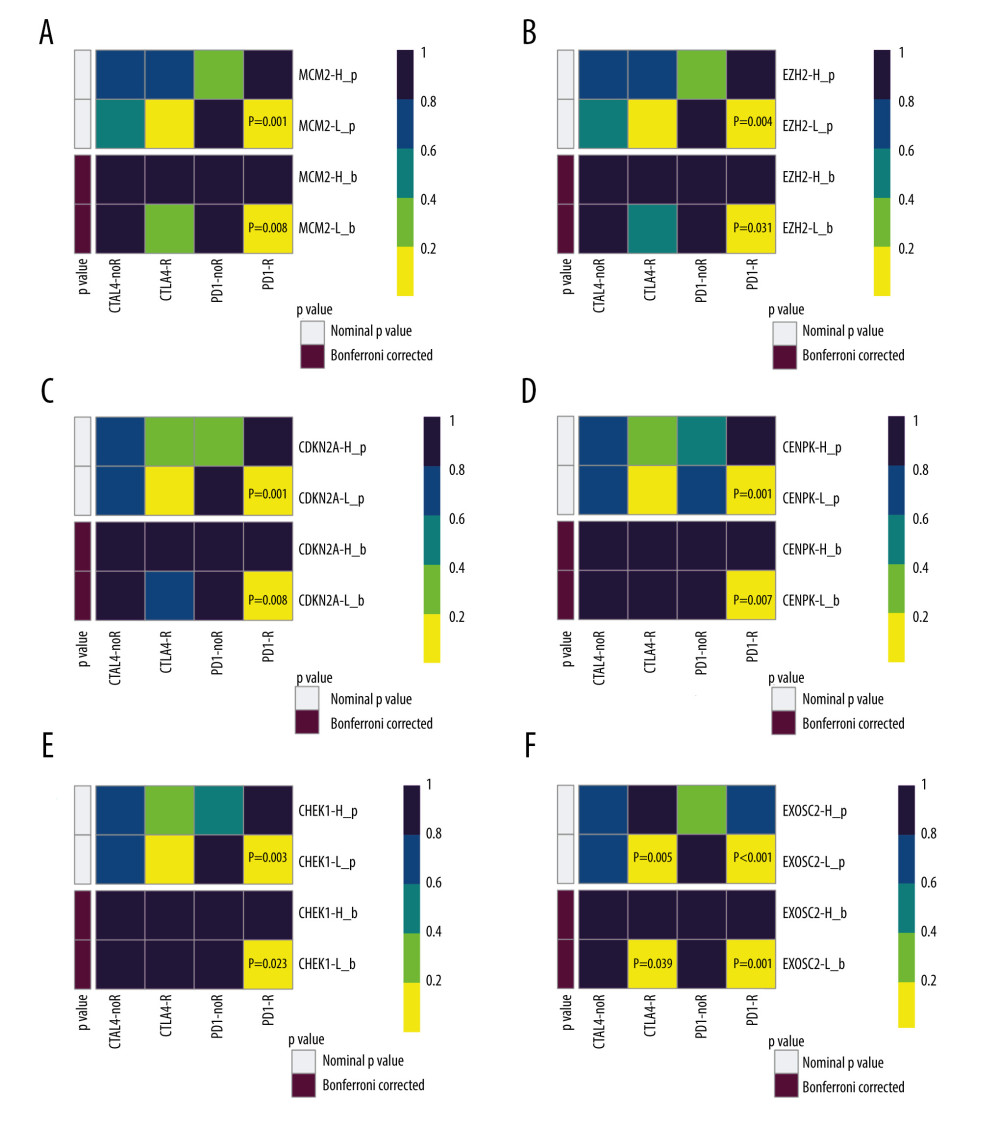 Figure 4. SubClass Mapping analysis of the 6 key genes to predict the likelihood of response to immune therapy. (A) Low expression of MCM2 was correlated with favorable response to anti-PD-1 treatment. (B) Low expression of EZH2 was correlated with favorable response to anti-PD-1 treatment. (C) Low expression of CDKN2A was correlated with favorable response to anti-PD-1 treatment. (D) Low expression of CENPK was correlated with favorable response to anti-PD-1 treatment. (E) Low expression of CHEK1 was correlated with favorable response to anti-PD-1 treatment. (F) Low expression of EXOSC2 was correlated with favorable response to anti-CTLA4 treatment and anti-PD-1 treatment. R – response; noR – no response; -L – low-expression group of certain gene; -H – high-expression group of certain gene. (R software (Version 4.0.0, http://www.r-project.org)).
 ![Assessment for chemotherapeutic responses to cisplatin and etoposide. (A) The estimated IC50 of cisplatin and etoposide to MCM-2. (B) The estimated IC50 of cisplatin and etoposide to EZH2. (C) The estimated IC50 of cisplatin and etoposide to CDKN2A. (D) The estimated IC50 of cisplatin and etoposide to CENPK. (E) The estimated IC50 of cisplatin and etoposide to CHEK1. (F) The estimated IC50 of cisplatin and etoposide to EXOSC2. (R software [Version 4.0.0, http://www.r-project.org]).](https://jours.isi-science.com/imageXml.php?i=medscimonit-27-e932275-g005.jpg&idArt=932275&w=1000) Figure 5. Assessment for chemotherapeutic responses to cisplatin and etoposide. (A) The estimated IC50 of cisplatin and etoposide to MCM-2. (B) The estimated IC50 of cisplatin and etoposide to EZH2. (C) The estimated IC50 of cisplatin and etoposide to CDKN2A. (D) The estimated IC50 of cisplatin and etoposide to CENPK. (E) The estimated IC50 of cisplatin and etoposide to CHEK1. (F) The estimated IC50 of cisplatin and etoposide to EXOSC2. (R software [Version 4.0.0, http://www.r-project.org]).
Figure 5. Assessment for chemotherapeutic responses to cisplatin and etoposide. (A) The estimated IC50 of cisplatin and etoposide to MCM-2. (B) The estimated IC50 of cisplatin and etoposide to EZH2. (C) The estimated IC50 of cisplatin and etoposide to CDKN2A. (D) The estimated IC50 of cisplatin and etoposide to CENPK. (E) The estimated IC50 of cisplatin and etoposide to CHEK1. (F) The estimated IC50 of cisplatin and etoposide to EXOSC2. (R software [Version 4.0.0, http://www.r-project.org]). 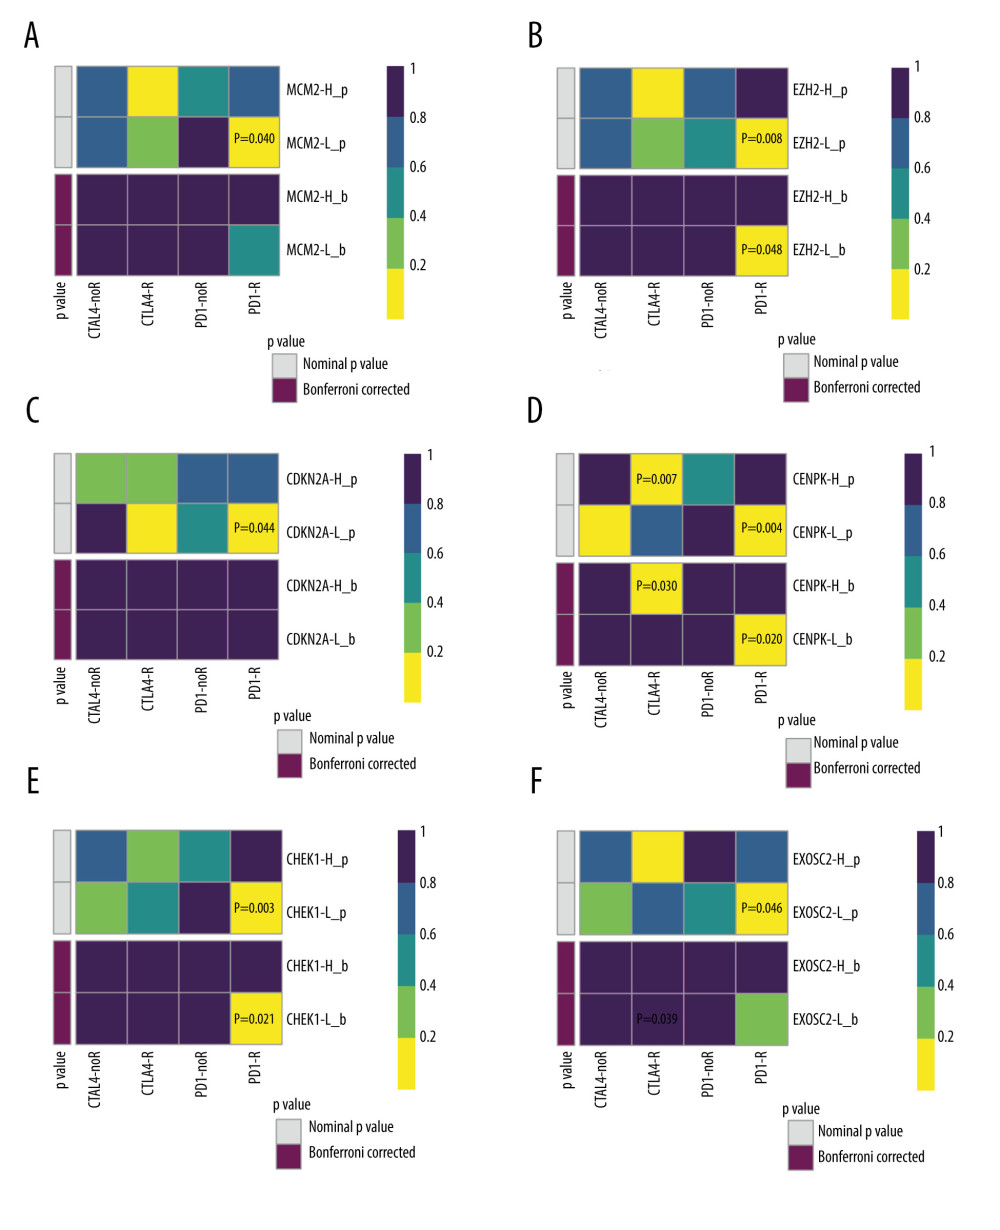 Figure 6. Validation of the 6 key genes to predict immunotherapeutic response in the CCLE cohort. (A) There was no significant correlation between MCM2 and immune response. (B) Low expression of EZH2 was correlated with favorable response to anti-PD-1 treatment. (C) There was no significant correlation between CDKN2A and immune response (D) Low expression of CENPK was correlated with favorable response to anti-PD-1 treatment. (E) Low expression of CHEK1 was correlated with favorable response to anti-PD-1 treatment. (F) There was no significant correlation between EXOSC2 and immune response. R – response; noR – no response; -L – low-expression group of certain gene; -H – high-expression group of certain gene. (R software (Version 4.0.0, http://www.r-project.org)).
 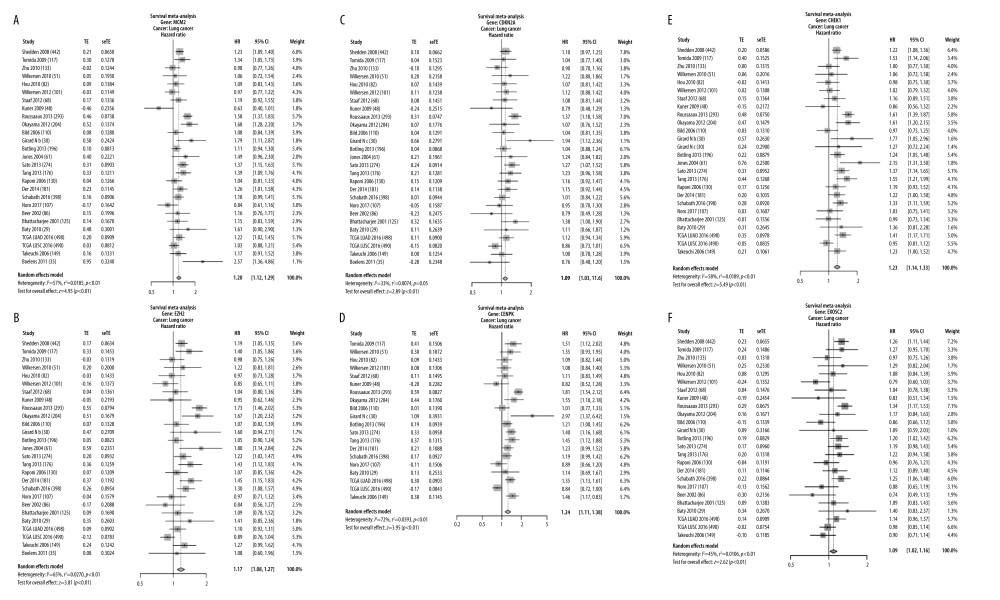 Figure 7. Validation of expression of the 6 potential biomarkers for the prognosis of SCLC in the LCE database. The forest plot presented the results of survival meta-analyses. (A) MCM2 was a risk factor in lung cancer (HR=1.20, 95% CI: 1.12–1.29). (B) EZH2 was a risk factor in lung cancer (HR=1.17, 95% CI: 1.08–1.27). (C) CDKN2A was a risk factor in lung cancer (HR=1.09, 95% CI: 1.03–1.16). (D) CENPK was a risk factor in lung cancer (HR=1.23, 95% CI: 1.11–1.38). (E) CHEK1 was a risk factor in lung cancer (HR=1.23, 95% CI: 1.14–1.33). (F) EXOSC2 was a risk factor in lung cancer (HR=1.09, 95% CI: 1.02–1.16). TE – log (HR); seTE – SE (log (HR)). (LCE database (http://lce.biohpc.swmed.edu/lungcancer/), meta-analyses module).
 References
1. Gazdar AF, Bunn PA, Minna JD, Small-cell lung cancer: What we know, what we need to know and the path forward: Nat Rev Cancer, 2017; 17(12); 725-37 [Erratum in: Nat Rev Cancer. 2017;17(12):765]
2. Cairns J, The interface between molecular biology and cancer research: Mutat Res, 2000; 462(2–3); 423-28
3. Demedts IK, Vermaelen KY, van Meerbeeck JP, Treatment of extensive-stage small cell lung carcinoma: current status and future prospects: Eur Respir J, 2010; 35; 202-15
4. Horn L, Mansfield AS, Szczęsna A, First-line atezolizumab plus chemotherapy in extensive-stage small-cell lung cancer: N Engl J Med; 379(23); 2220-29 20186
5. Ku GY, Yuan J, Page DB, Single-institution experience with ipilimumab in advanced melanoma patients in the compassionate use setting: Lymphocyte count after 2 doses correlates with survival: Cancer, 2010; 116(7); 1767-75
6. Ready N, Farago AF, de Braud F, Third-line nivolumab monotherapy in recurrent SCLC: CheckMate 032: J Thorac Oncol, 2019; 14(2); 237-44
7. Spigel DR, Vicente D, Ciuleanu TE, Second-line nivolumab in relapsed small-cell lung cancer: CheckMate 331: Ann Oncol, 2021; 32(5); 631-41
8. Hellmann MD, Callahan MK, Awad MM, Tumor mutational burden and efficacy of nivolumab monotherapy and in combination with ipilimumab in small-cell lung cancer: Cancer Cell, 2018; 33; 853-61.e854
9. Barrett T, Wilhite SE, Ledoux P, NCBI GEO: Archive for functional genomics data sets – update: Nucleic Acids Res, 2013; 41(Database issue); D991-95
10. Barretina J, Caponigro G, Stransky N, The Cancer Cell Line Encyclopedia enables predictive modelling of anticancer drug sensitivity: Nature, 2012; 483(7391); 603-7 [Erratum in: Nature. 2012;492(7428):290, Erratum in: Nature. 2019;565(7738):E5–E6]
11. Ru B, Wong CN, Tong Y, TISIDB: An integrated repository portal for tumor-immune system interactions: Bioinformatics, 2019; 35(20); 4200-2
12. Ritchie ME, Phipson B, Wu D, limma powers differential expression analyses for RNA-sequencing and microarray studies: Nucleic Acids Res, 2015; 43(7); e47
13. Zhou Y, Zhou B, Pache L, Metascape provides a biologist-oriented resource for the analysis of systems-level datasets: Nat Commun, 2019; 10(1); 1523
14. Kassambara A, Kosinski M, Biecek P: Survminer: Drawing survival curves using ‘ggplot2’R package version 0.4.4 Available from: https://CRAN.R-project.org/package=survminer
15. Hoshida Y, Brunet JP, Tamayo P, Subclass mapping: Identifying common subtypes in independent disease data sets: PLoS One, 2007; 2(11); e1195
16. Roh W, Chen PL, Reuben A, Integrated molecular analysis of tumor biopsies on sequential CTLA-4 and PD-1 blockade reveals markers of response and resistance: Sci Transl Med, 2017; 9(379) eaah3560
17. Yang W, Soares J, Greninger P, Genomics of Drug Sensitivity in Cancer (GDSC): A resource for therapeutic biomarker discovery in cancer cells: Nucleic Acids Res, 2013; 41(Database issue); D955-61
18. Geeleher P, Cox N, Huang RS, pRRophetic: An R package for prediction of clinical chemotherapeutic response from tumor gene expression levels: PLoS One, 2014; 9(9); e107468
19. Cai L, Lin S, Girard L, LCE: An open web portal to explore gene expression and clinical associations in lung cancer: Oncogene, 2019; 38(14); 2551-64 [Erratum in: Oncogene. 2020;39(3):718–19]
20. Ricciuti B, Kravets S, Dahlberg SE, Use of targeted next generation sequencing to characterize tumor mutational burden and efficacy of immune checkpoint inhibition in small cell lung cancer: J Immunother Cancer, 2019; 7(1); 87
21. de Andrade BA, León JE, Carlos R, Expression of minichromosome maintenance 2, Ki-67, and geminin in oral nevi and melanoma: Ann Diagn Pathol, 2013; 17(1); 32-36
22. Czyzewska J, Guzińska-Ustymowicz K, Pryczynicz A, Immunohistochemical evaluation of Ki-67, PCNA and MCM2 proteins proliferation index (PI) in advanced gastric cancer: Folia Histochem Cytobiol, 2009; 47(2); 289-96
23. Guzińska-Ustymowicz K, Pryczynicz A, Kemona A, Czyzewska J, Correlation between proliferation markers: PCNA, Ki-67, MCM-2 and antiapoptotic protein Bcl-2 in colorectal cancer: Anticancer Res, 2009; 29(8); 3049-52
24. Yousef EM, Furrer D, Laperriere DL, Tahir MR, MCM2: An alternative to Ki-67 for measuring breast cancer cell proliferation: Mod Pathol, 2017; 30(5); 682-97
25. Fujii K, Miyata Y, Takahashi I, Differential proteomic analysis between Small Cell Lung Carcinoma (SCLC) and pulmonary carcinoid tumors reveals molecular signatures for malignancy in lung cancer: Proteomics Clin Appl, 2018; 12(6); e1800015
26. Gou K, Liu J, Feng X, Expression of Minichromosome Maintenance Proteins (MCM) and cancer prognosis: A meta-analysis: J Cancer, 2018; 9(8); 1518-26
27. Byers LA, Wang J, Nilsson MB, Proteomic profiling identifies dysregulated pathways in small cell lung cancer and novel therapeutic targets including PARP1: Cancer Discov, 2012; 2(9); 798-811
28. Hubaux R, Thu KL, Coe BP, EZH2 promotes E2F-driven SCLC tumorigenesis through modulation of apoptosis and cell-cycle regulation: J Thorac Oncol, 2013; 8(8); 1102-6
29. Gardner EE, Lok BH, Schneeberger VE, Chemosensitive relapse in small cell lung cancer proceeds through an EZH2-SLFN11 axis: Cancer Cell, 2017; 31(2); 286-99
30. Toyokawa G, Takada K, Tagawa T, Prevalence of enhancer of zeste homolog 2 in patients with resected small cell lung cancer: Anticancer Res, 2018; 38(6); 3707-11
31. Sato T, Kaneda A, Tsuji S, PRC2 overexpression and PRC2-target gene repression relating to poorer prognosis in small cell lung cancer: Sci Rep, 2013; 3; 1911
32. Nagarsheth N, Peng D, Kryczek I, PRC2 epigenetically silences Th1-type chemokines to suppress effector T-cell trafficking in colon cancer: Cancer Res, 2016; 76(2); 275-82
33. Peng D, Kryczek I, Nagarsheth N, Epigenetic silencing of TH1-type chemokines shapes tumour immunity and immunotherapy: Nature, 2015; 527(7577); 249-53
34. Bugide S, Green MR, Wajapeyee N, Inhibition of enhancer of zeste homolog 2 (EZH2) induces natural killer cell-mediated eradication of hepatocellular carcinoma cells: Proc Natl Acad Sci USA, 2018; 115(15); E3509-18
35. Vasen H, Ibrahim I, Ponce CG, Benefit of surveillance for pancreatic cancer in high-risk individuals: Outcome of long-term prospective follow-up studies from three European expert xenters: J Clin Oncol, 2016; 34(17); 2010-19
36. Lee Y-C, Huang C-C, Lin D-Y, Overexpression of centromere protein K (CENPK) in ovarian cancer is correlated with poor patient survival and associated with predictive and prognostic relevance: Peer J, 2015; 3; e1386
37. Liu B, Qu J, Xu F, MiR-195 suppresses non-small cell lung cancer by targeting CHEK1: Oncotarget, 2015; 6(11); 9445-56
38. Mohni KN, Kavanaugh GM, Cortez D, ATR pathway inhibition is synthetically lethal in cancer cells with ERCC1 deficiency: Cancer Res, 2014; 74(10); 2835-45
39. Yashiro T, Koyama-Saegusa K, Imai T, Inhibition of potential lethal damage repair and related gene expression after carbon-ion beam irradiation to human lung cancer grown in nude mice: J Radiat Res, 2007; 48(5); 377-83
40. Höglund A, Nilsson LM, Muralidharan SV, Therapeutic implications for the induced levels of Chk1 in Myc-expressing cancer cells: Clin Cancer Res, 2011; 17(22); 7067-79
Figures
Figure 1. The flowchart of our study (Biorender website, https://biorender.com/).Figure 2. Identification of candidate genes related to immunotherapy. (A) Identification of common differentially expressed genes from 3 datasets. (B) The gene ontology annotation and pathway enrichment analysis of differentially expressed genes. (C) PPI networks and 11 subclusters of differentially expressed genes. R software Version 4.0.0 (http://www.r-project.org) and Metascape online tools http://metascape.org/gp/index.html#/main/step1.Figure 3. (A) Overall survival according to the expression of the 6 selected genes modulated in SCLC. (B) Heatmap demonstrated the expression level of 6 selected genes between normal and tumor tissue. (C) Correlation heatmap of the 6 selected genes. R software Version 4.0.0 http://www.r-project.org.Figure 4. SubClass Mapping analysis of the 6 key genes to predict the likelihood of response to immune therapy. (A) Low expression of MCM2 was correlated with favorable response to anti-PD-1 treatment. (B) Low expression of EZH2 was correlated with favorable response to anti-PD-1 treatment. (C) Low expression of CDKN2A was correlated with favorable response to anti-PD-1 treatment. (D) Low expression of CENPK was correlated with favorable response to anti-PD-1 treatment. (E) Low expression of CHEK1 was correlated with favorable response to anti-PD-1 treatment. (F) Low expression of EXOSC2 was correlated with favorable response to anti-CTLA4 treatment and anti-PD-1 treatment. R – response; noR – no response; -L – low-expression group of certain gene; -H – high-expression group of certain gene. (R software (Version 4.0.0, http://www.r-project.org)).Figure 5. Assessment for chemotherapeutic responses to cisplatin and etoposide. (A) The estimated IC50 of cisplatin and etoposide to MCM-2. (B) The estimated IC50 of cisplatin and etoposide to EZH2. (C) The estimated IC50 of cisplatin and etoposide to CDKN2A. (D) The estimated IC50 of cisplatin and etoposide to CENPK. (E) The estimated IC50 of cisplatin and etoposide to CHEK1. (F) The estimated IC50 of cisplatin and etoposide to EXOSC2. (R software [Version 4.0.0, http://www.r-project.org]).Figure 6. Validation of the 6 key genes to predict immunotherapeutic response in the CCLE cohort. (A) There was no significant correlation between MCM2 and immune response. (B) Low expression of EZH2 was correlated with favorable response to anti-PD-1 treatment. (C) There was no significant correlation between CDKN2A and immune response (D) Low expression of CENPK was correlated with favorable response to anti-PD-1 treatment. (E) Low expression of CHEK1 was correlated with favorable response to anti-PD-1 treatment. (F) There was no significant correlation between EXOSC2 and immune response. R – response; noR – no response; -L – low-expression group of certain gene; -H – high-expression group of certain gene. (R software (Version 4.0.0, http://www.r-project.org)).Figure 7. Validation of expression of the 6 potential biomarkers for the prognosis of SCLC in the LCE database. The forest plot presented the results of survival meta-analyses. (A) MCM2 was a risk factor in lung cancer (HR=1.20, 95% CI: 1.12–1.29). (B) EZH2 was a risk factor in lung cancer (HR=1.17, 95% CI: 1.08–1.27). (C) CDKN2A was a risk factor in lung cancer (HR=1.09, 95% CI: 1.03–1.16). (D) CENPK was a risk factor in lung cancer (HR=1.23, 95% CI: 1.11–1.38). (E) CHEK1 was a risk factor in lung cancer (HR=1.23, 95% CI: 1.14–1.33). (F) EXOSC2 was a risk factor in lung cancer (HR=1.09, 95% CI: 1.02–1.16). TE – log (HR); seTE – SE (log (HR)). (LCE database (http://lce.biohpc.swmed.edu/lungcancer/), meta-analyses module). In Press
06 Mar 2024 : Clinical Research
Comparison of Outcomes between Single-Level and Double-Level Corpectomy in Thoracolumbar Reconstruction: A ...Med Sci Monit In Press; DOI: 10.12659/MSM.943797
21 Mar 2024 : Meta-Analysis
Economic Evaluation of COVID-19 Screening Tests and Surveillance Strategies in Low-Income, Middle-Income, a...Med Sci Monit In Press; DOI: 10.12659/MSM.943863
10 Apr 2024 : Clinical Research
Predicting Acute Cardiovascular Complications in COVID-19: Insights from a Specialized Cardiac Referral Dep...Med Sci Monit In Press; DOI: 10.12659/MSM.942612
06 Mar 2024 : Clinical Research
Enhanced Surgical Outcomes of Popliteal Cyst Excision: A Retrospective Study Comparing Arthroscopic Debride...Med Sci Monit In Press; DOI: 10.12659/MSM.941102
Most Viewed Current Articles
17 Jan 2024 : Review article
Vaccination Guidelines for Pregnant Women: Addressing COVID-19 and the Omicron VariantDOI :10.12659/MSM.942799
Med Sci Monit 2024; 30:e942799
14 Dec 2022 : Clinical Research
Prevalence and Variability of Allergen-Specific Immunoglobulin E in Patients with Elevated Tryptase LevelsDOI :10.12659/MSM.937990
Med Sci Monit 2022; 28:e937990
16 May 2023 : Clinical Research
Electrophysiological Testing for an Auditory Processing Disorder and Reading Performance in 54 School Stude...DOI :10.12659/MSM.940387
Med Sci Monit 2023; 29:e940387
01 Jan 2022 : Editorial
Editorial: Current Status of Oral Antiviral Drug Treatments for SARS-CoV-2 Infection in Non-Hospitalized Pa...DOI :10.12659/MSM.935952
Med Sci Monit 2022; 28:e935952