10 December 2021: Clinical Research
Development and Validation of a Random Forest Risk Prediction Pneumothorax Model in Percutaneous Transthoracic Needle Biopsy
Hong Lin Wu1ABCDEF, Gao Wu Yan2ADF, Li Cheng Lei3BC, Yong Du4AD, Xiang Ke Niu1DF, Tao Peng1FG*DOI: 10.12659/MSM.932137
Med Sci Monit 2021; 27:e932137


Abstract
BACKGROUND: Computed tomography (CT)-guided percutaneous transthoracic needle biopsy (PTNB) is an effective means for diagnosing various thoracic diseases. Pneumothorax is the most common complication, and when it becomes life-threatening, urgent medical intervention is required. The purpose of this study was to develop and validate a model that can be used to predict postoperative pneumothorax following CT-guided PTNB.
MATERIAL AND METHODS: We enrolled 245 patients who completed CT-guided PTNB to develop the model. A random forest (RF) model was built using 15 risk factors (15-RFs). The 7 most critical risk factors (7-RFs) were extracted by feature selection and used to build a new model. The independent external validation data contained 97 patients. Logistic regression (LR), support vector machine (SVM), and decision tree (DT) models were also developed using both 15-RFs and 7-RFs, and their performance was compared with the RF models.
RESULTS: The length of the aerated lung traversed was identified as the most important risk factor for developing pneumothorax, followed by angle of pleural puncture, lesion depth, lesion size, age, procedure time, and sex. The RF model demonstrated better performance in the development and validation datasets when compared with the LR, SVM, and DT based on 15-RFs and 7-RFs. According to DeLong’s test for difference in ROC curves, the RF models based on the 15-RFs and 7-RFs achieved similar classification performance (P>0.05).
CONCLUSIONS: This study demonstrated the feasibility of using the 7-RFs RF model for predicting postoperative pneumothorax before patients undergo CT-guided PTNB.
Keywords: Decision Support Techniques, Image-Guided Biopsy, machine learning, Pneumothorax, Age Factors, Aged, 80 and over, Biopsy, Needle, Feasibility Studies, Female, Humans, Male, Patient Acuity, Postoperative Complications, Radiography, Interventional, Reproducibility of Results, Risk Factors, Tomography, X-Ray Computed, young adult
Background
Computed tomography (CT)-guided percutaneous transthoracic needle biopsy (PTNB) is a common method used to establish the pathological diagnosis of pulmonary nodules or masses. CT-guided PTNB has high diagnostic accuracy and an acceptable complication rate [1]. However, pneumothorax occurs more often than other complications [2–4], with an incidence rate ranging from 4.0% to 62.0% [5,6]. As a result of the pneumothorax, patients often suffer from restlessness, shortness of breath, asphyxia, hypotension and cold sweat, shock, and even unconsciousness. Pneumothorax can also become a life-threatening condition requiring urgent intervention. Therefore, a preliminary screening tool that can be used by interventional physicians to predict the postoperative pneumothorax for patients undergoing CT-guided PTNB is essential to improve patient selection, preoperative preparation, procedural techniques, and postoperative management [7,8], such as using oxygen delivery by facemask or nasal cannula, shortening the length of the aerated lung traversed by the needle, and extending the period of vital signs monitoring.
In recent years, there has been a surge of interest in utilizing artificial intelligence and machine learning algorithms in the field of medicine for early disease diagnosis and risk prediction [9–12]. However, the majority of current machine learning models focus on the diagnosis and localization of pneumothorax on either chest radiographs or CT after the PTNB [13,14]. Only a few predictive models are available for determining the risk of developing pneumothorax after PTNB. Zhao et al and Wang et al developed logistic regression (LR) models to predict the risk of developing a pneumothorax [7,15]. The types of the pneumothorax model were still unitary, and the accuracy and sensitivity of these models were poor [15].
Previous studies demonstrated that random forest (RF) could adapt to complex clinical conditions and accurately predict or diagnose diverse cases [16,17]. LR is a generalized linear model, while RF is a nonlinear model. Furthermore, RF is less prone to overfitting and more robust when compared with LR [18]. To the best of our knowledge, RF risk prediction models for pneumothorax after CT-guided PTNB based on patient and lesion characteristics, as well as procedure-related risk factors, have not yet been explored.
Therefore, this study aimed to develop and validate an effective RF-based pneumothorax prediction model for patients undergoing CT-guided PTNB using the risk factors previously reported in the literature and based on our clinical experience [15–17].
Material and Methods
ETHICS:
This retrospective study was approved by our institutional review board (Approval number: PJ2020-003-02). Written informed consent was obtained from all patients enrolled for the CT-guided PTNB.
DATA COLLECTION:
The data were collected from 2 different institutes in China. The data from institution A were used to develop the algorithm, while the data from institution B were used to validate the algorithm (Figure 1).
From May 2016 to May 2017, 1056 consecutive patients who underwent CT-guided PTNB at institute A were enrolled, and the rate of pneumothorax was 11.3%. We excluded patients presenting with pleural effusion, patients with non-solitary pulmonary nodule or mass, lesions with a maximum diameter smaller than 5 mm, and lesions located in either the mediastinum, pleura, or chest wall, as well as patients with incomplete data also (Figure 1). A total of 245 patients (174 males and 71 females) with a mean age of 61.6 years (range: 28–85, standard deviation (SD)±9.9) were finally included in the study and used to develop the algorithm. Forty-four percent (n=108) of these patients had a pneumothorax, while the rest (n=137) had no pneumothorax. The patient and lesion characteristics of the development data are summarized in Table 1.
A total of 124 consecutive patients who underwent CT-guided PTNB between March 2017 and January 2021 at institute B were enrolled, and the rate of pneumothorax was 54.0%. Seventy-eight percent (n=97) of these patients met the exclusion criterion (Figure 1). The patient group consisted of 62 males and 35 females, and the mean age was 62.8 years (range: 20–86 years, SD±12.0). The patient and lesion characteristics of the external validation data are summarized in Table 2.
BIOPSY TECHNIQUE:
Six interventional radiologists with 3–5 years of experience performed all CT-guided PTNBs procedures according to a standard protocol [19]. All CT scans in institute A were acquired using a 16-detector MX, Phillips Medical Systems, Best, Netherlands CT scanner using 120 mAs, 120 kV, and a 2.0–3.0 mm slice thickness. Biopsies were performed using the coaxial method with a 19-gauge coaxial guide needle (C2016B, Bard) and a 20-gauge automated core biopsy needle (MN2016, Bard). In institute B, all CT scans were acquired with a scanner (LightSpeed VCT; GE Healthcare, Waukesha, Wis) using 140 mAs, 120KV, and a slice thickness of 1.0–2.0 mm. Biopsies were also performed using the coaxial method with a 17-gauge coaxial guide needle (C1816A, Bard Peripheral Vascular, Inc.) and an 18-gauge automated core biopsy needle (MC1816, Bard Peripheral Vascular, Inc.).
MEASURED VARIABLES:
Based on information in the literature, 15 patient-, lesion-, and procedure-related risk factors were identified and data on them were collected for analysis [13,16,17]. Patient-related risk factors included age and sex. Lesion-related risk factors included lesion size (the maximum short-axis diameter), lesion location, lesion depth (the shortest distance from the costal pleura to the edge of the lesion), presence of a cavity inside the lesion, emphysema or bullae adjacent to the biopsy track, and pneumonitis around the lesion. When the lesion is in direct contact with the pleura, the lesion depth is 0.0 mm. Biopsy procedure-related risk factors included length of the aerated lung traversed by the needle (the distance from the pleural puncture point to the edge of lesion along the needle path) [20], angle of pleural puncture, procedure time (total needle insertion and removal time), biopsy position, the crossing of the pleural indentation or interlobar fissure, and the number of biopsies acquired. The measurement methods used to calculate the risk factors for developing pneumothorax are illustrated in Figure 2. Pneumothorax was classified as either mild, moderate, or severe according to the largest distance between parietal pleura and visceral pleura on axial CT images [21] (Figure 2C).
MODEL DEVELOPMENT AND FEATURE SELECTION:
A total of 245 patients were randomly divided using a ratio of 8: 2 into the training and testing datasets. The 15-RFs were first used to develop 4 pneumothorax risk models: LR, support vector machine (SVM), decision tree (DT), and RF. The output of the models was then labeled as either positive (1) or negative (0) for pneumothorax. Then, the more relevant risk factors were selected using RF feature selection. RF is an ensemble of classification trees. Each individual RF tree was set as internal nodes and leaves. The selected feature was used to make a decision on how to divide the data set into 2 separate sets with similar responses. The internal nodes features were selected using a criterion based on the Gini impurity classification. The importance of the feature, also known as the Gini importance, was computed as the (normalized) total reduction of the criterion brought by that feature [22]. To determine the optimum risk factor subset, the relationship between the AUCs of the RF model and the number of risk factors were evaluated. Finally, we redeveloped these models using the most relevant risk factors. All models on the development dataset were then applied to the external validation dataset obtained from institute B. All models were built using the Python environment (version 3.8, Beaverton, Ore) by using the sklearn, numpy, pandas, and scipy packages.
STATISTICAL ANALYSIS:
Statistical analyses were performed using SPSS version 26 (IBM Analytics Products, USA). Continuous variables were summarized as mean and standard deviation (mean±SD), while categorical variables were summarized using frequencies and percentages. Correlation analysis was performed by Pearson correlation analysis. The Mann-Whitney U test and chi-square test were used in between-group comparisons. The models’ performance was assessed by calculating the area under the curve (AUC) of a receiver operating characteristic curve (ROC). The DeLong test was used to statistically compare the ROC curves of all models [23]. The sensitivity, specificity, accuracy, positive predictive value (PPV), and negative predictive value (NPV) for all developed models were also calculated. For all statistical tests, a P value of 0.05 or less was considered to be statistically significant.
Results
CLINICAL CHARACTERISTICS:
To develop and validate the 4 models (LR, SVM, DT, and RF) for the prediction of pneumothorax, we used the development data of 245 patients and external validation data of 97 patients. Within the development dataset, pneumothorax was mild in 86 (79.6%), moderate in 18 (16.7%), and severe in 4 (3.7%) patients, while in the external dataset, pneumothorax was mild in 48 (88.9%), moderate in 3 (5.6%), and severe in 3 (5.6%) patients. There was no postoperative delayed pneumothorax. Very often, patients with mild pneumothorax are not provided any treatment and are instead put under observation. The placement of a chest tube (n=28) is only considered if the pneumothorax becomes symptomatic or more severe. The detailed characteristics of the development and external validation data are summarized in Tables 1 and 2.
FEATURE SELECTION:
The risk factors are shown in order of the importance of pneumothorax in Figure 3A. The predictive performance (AUCs) of RF models for each number of risk factors are shown in Figure 3B. The AUCs of RFs reached an approximate plateau when the top-6 risk factors were introduced. In addition, univariate analysis showed a significant difference in sex between 2 groups (P=0.003). Considering the clinical circumstance, so the top-7 ranked risk factors were identified as the optimum risk factor subset. The length of the aerated lung traversed was identified as the most important risk factor for developing pneumothorax, followed by angle of pleural puncture, lesion depth, lesion size, age, procedure time, and sex.
PERFORMANCE OF PREDICTION MODELS:
The sensitivity, specificity, accuracy, PPV, and NPV were calculated for all models using both development and validation datasets, which are summarized in Tables 3 and 4. The prediction performance of the models was assessed using the AUC, as illustrated in Figure 4. According to DeLong’s test for difference in ROC curves, the LR, DT, and RF models based on either 15-RFs or 7-RFs achieved similar classification performance (P>0.05). In contrast, the SVM model had significantly lower levels based on 7-RFs (P<0.05). All models yielded an AUC above 0.599, with the RF model achieving the highest accuracy, with an AUC of 0.921. In the external validation dataset, based on 7-RFs, the RF model achieved an AUC of 0.914 (P<0.05), which was significantly higher than all other models, as shown in Table 5.
Discussion
In this study, we developed the first pneumothorax prediction model using the RF algorithm based on the patient, lesion, and procedure-related risk factors. Furthermore, to minimize the risk of overfitting the RF models, we evaluated the model’s diagnostic performance using a separate external validation dataset. We also compared the performance of the RF model with other commonly used prediction models, including LR, SVM, and DT.
The 7-RFs RF model proposed in our study achieved the best performance, with an AUC of 0.914 on the validation dataset, indicating that the RF model fit well with the relationship between risk factors and pneumothorax. Therefore, this model may be used clinically to reduce the risk of developing pneumothorax by changing controllable factors such as the angle of pleural puncture and also by improving the postoperative management of high-risk patients.
To date, among the various machine learning methods, only multivariate LR analysis has been used to develop a predictive model for pneumothorax after a CT-guided needle biopsy. Zhao et al established a predictive LR model based on 6 risk factors, which resulted in an AUC, sensitivity, specificity, and accuracy of 0.735, 0.568, 0.796, and 0.725, respectively [15]. However, this model was not externally validated. In another study, Wang et al used a multivariable LR to develop a predictive model based on 5 risk factors filtered by using the lasso regression method. The model had good predictive ability in both the development dataset (AUC=0.801) and in the external validation dataset (AUC=0.738) [7]. In comparison, our LR model achieved a lower AUC, slightly higher sensitivity, and marginally lower specificity and accuracy. This variation may be due to the use of different risk prediction factors. In the present study, the RF model demonstrated higher sensitivity, specificity, accuracy, PPV, NPV, and AUC when compared with the LR, SVM, and DT models in both development and validation datasets for both 15-RFs and 7-RFs (Tables 3–5). Moreover, for all models except for SVM, there was no statistically significant difference in the ROC curves between the 15-RFs and 7-RFs models in both the development and external validation datasets (Table 5). These findings may suggest that a predictive model based on only 7-RFs is sufficient and may be implemented clinically, hence facilitating clinical decision-making.
Our findings identified the length of the aerated lung traversed as the most important risk factor for the development of pneumothorax, followed by angle of pleural puncture, lesion depth, lesion size, age, procedure time, and sex (Figure 3A). An interesting finding of this study was that among the 7 critical risk factors identified in our study, 3 of them – length of the aerated lung traversed, angle of pleural puncture, and procedure time – are related to the puncture procedure. This implies that the risk of developing pneumothorax may be reduced by optimizing the surgical procedure.
Previous studies found that the length of the lung parenchyma traversed by the biopsy tract was the most important factor for pneumothorax [24,25], as also identified in our study. In our study, the measurement method of lesion depth was different from that in the past, and lesion depth was positively correlated with the length of the aerated lung traversed in both development and validation datasets (r=0.658,
Our study has a number of limitations that have to be acknowledged. First, some factors, such as the radiologists’ experience, needle size, and other complications, such as hemorrhage or hemothorax, were not included in the models. The model proposed in this study can only be used to predict the occurrence of postoperative pneumothorax, not the severity. However, the prediction of pneumothorax following PTNB is more important for patients exhibiting oxygen desaturation, as they require immediate catheter insertion. Therefore, further stratified analysis involving more participants with moderate or severe pneumothorax is required. The small sample size in our study may have resulted in selection bias or operator biases, potentially limiting the generalizability of the research findings. To further validate our results, additional studies including data from multiple institutions are warranted. Future studies should also compare the performance of our RF model with other machine learning models. Future models should also establish prediction thresholds. Finally, a prospective study on the association of the predictions with the resultant outcome is needed to clinically validate the prediction accuracy of this model.
Conclusions
The RF models resulted in high precision accuracy in the prediction for pneumothorax and performed better than the LR, SVM, and DT models. There was no statistically significant difference between the 15-RFs and 7-RFs RF models, suggesting that the 7-RFs model is sufficient to clinically determine the risk for developing pneumothorax. The 7-RFs RF model may be used to facilitate preemptive decisions in patients deemed at higher risk of developing pneumothorax, which may include procedure optimization and better postoperative management.
Figures
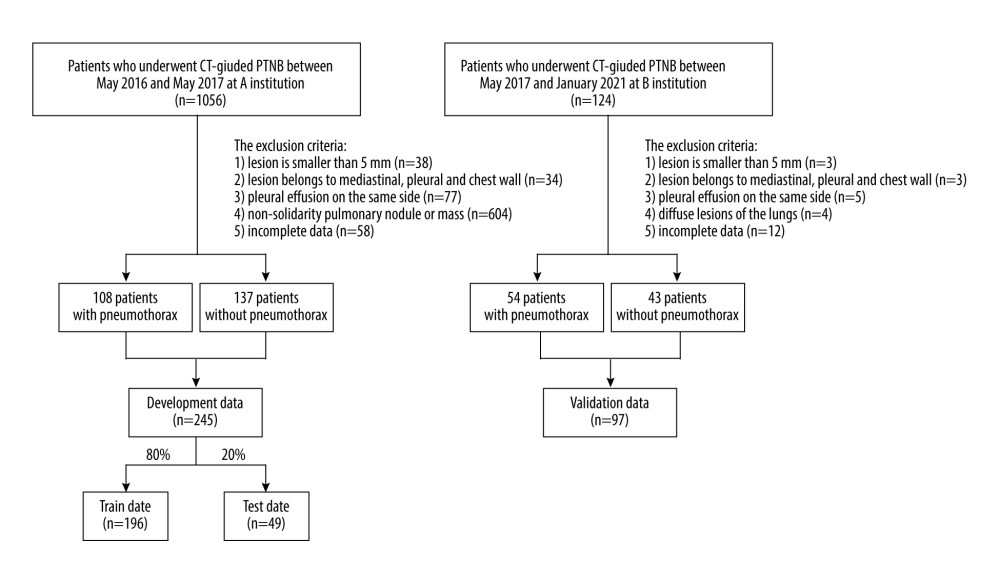 Figure 1. Flow diagram for the development and validation data.
 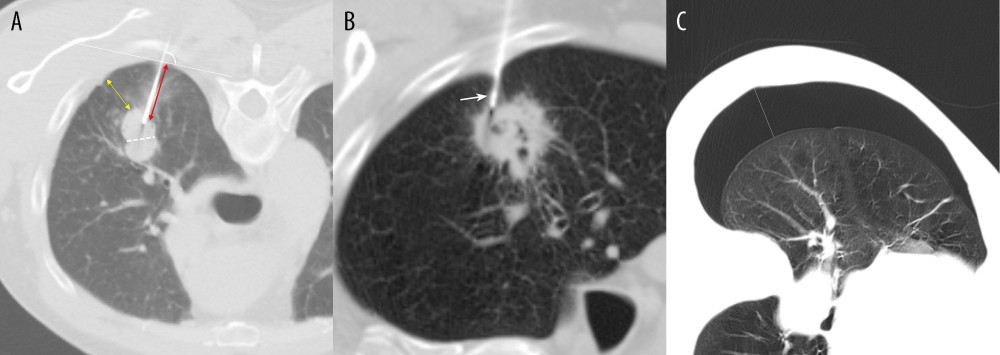 Figure 2. Measurement methods. (A) Axial chest CT image in a 61-year-old male patient demonstrates a solid nodule in the right upper lobe. The lesion size is measured along the maximum short-axis diameter (white dotted line). The lesion depth is measured from the costal pleura to the nearest edge of the lesion (yellow double arrows). The length of the aerated lung traversed by the needle is measured from the pleural puncture point to the edge of lesion along the needle path (red double arrows). The angle of pleural puncture is the smallest angle between a line along the needle route and a tangential line to the pleura (white arc). (B) Axial chest CT image in a 78-year-old male patient demonstrates a cavitary lesion in the right upper lobe. The biopsy needle passed through the pleural indentation (white arrow). (C) Axial chest CT image demonstrates the pneumothorax measurement. The longest distance between parietal pleura and visceral pleura (white line).
 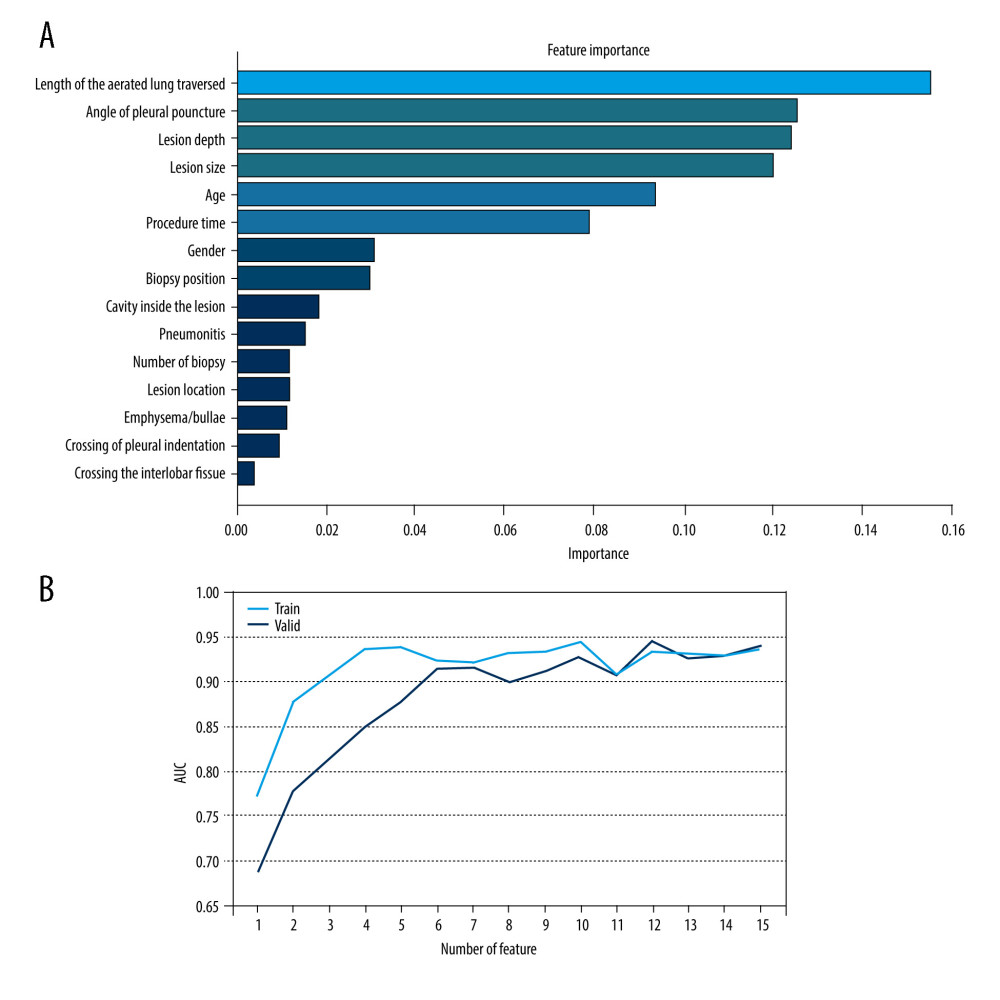 Figure 3. Feature selection. (A) Ranking of important risk factors for the prediction of pneumothorax. (B) Predictive performance (AUCs) of the RF models at each number of risk factors in the development data and the external validation date.
 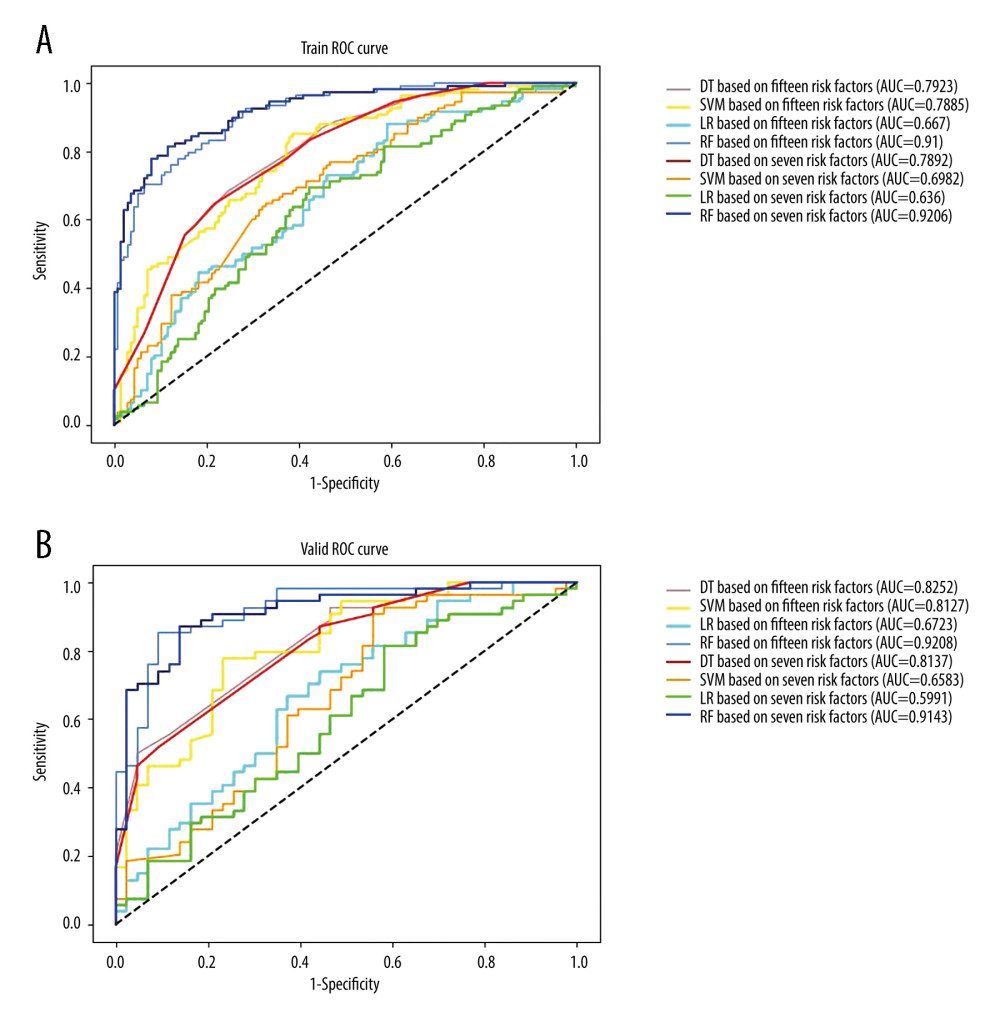 Figure 4. Receiver operating characteristic curves (ROCs) and the areas under the curves (AUCs) of models in (A) the development data based on 15 risk factors versus 7 critical risk factors, (B) the validation data based on 15 risk factors versus 7 critical risk factors.
 References
1. O’Neill AC, McCarthy C, Ridge CA, Rapid needle-out patient-rollover time after percutaneous CT-guided transthoracic biopsy of lung nodules: effect on pneumothorax rate: Radiology, 2012; 262(1); 314-19
2. Cox JE, Chiles C, McManus CM, Transthoracic needle aspiration biopsy: Variables that affect risk of pneumothorax: Radiology, 1999; 212(1); 165-68
3. Nour-Eldin NEA, Alsubhi M, Emam A, Pneumothorax complicating coaxial and non-coaxial CT-guided lung biopsy: Comparative analysis of determining risk factors and management of pneumothorax in a retrospective review of 650 patients: Cardiovasc Inter Rad, 2016; 39(2); 261-70
4. IIbukuro K, Tanaka R, Takeguchi T, Air embolism and needle track implantation complicating CT-guided percutaneous thoracic biopsy: Single-institution experience: Am J Roentgenol, 2009; 193(5); 430-36
5. Laspas F, Roussakis A, Efthimiadou R, Percutaneous CT-guided fine-needle aspiration of pulmonary lesions: Results and complications in 409 patients: J Med Imag Radiat, 2008; 52(5); 458-62
6. Wallace MJ, Krishnamurthy S, Broemeling LD, CT-guided percutaneous fine-needle aspiration biopsy of small (≤1.0 cm) pulmonary lesions: Radiology, 2002; 225(3); 823-28
7. Wang S, Tu J, Chen W, Development and validation of a prediction pneumothorax model in CT-guided transthoracic needle biopsy for solitary pulmonary nodule: Biomed Res Int, 2019; 2019; 7857310
8. Mortani Barbosa EJ, Sachs N, CT fluoroscopy guided thoracic biopsies (CTTB) are highly accurate and safe: Outcomes and predictive modeling of complications utilizing machine learning: Acad Radiol, 2021; 28(5); 608-18
9. Arabasadi Z, Alizadehsani R, Roshanzamir M, Computer aided decision making for heart disease detection using hybrid neural network-Genetic algorithm: Comput Methods Programs Biomed, 2017; 141; 19-26
10. Choi KJ, Jang JK, Lee SS, Development and validation of a deep learning system for staging liver fibrosis by using contrast agent-enhanced CT images in the liver: Radiology, 2018; 289(3); 688-97
11. Choy G, Khalilzadeh O, Michalski M, Current applications and future impact of machine learning in radiology: Radiology, 2018; 288(2); 318-28
12. Esteva A, Kuprel B, Novoa RA, Dermatologist-level classification of skin cancer with deep neural networks: Nature, 2017; 542(7639); 115-18
13. Li X, Thrall JH, Digumarthy SR, Deep learning-enabled system for rapid pneumothorax screening on chest CT: Eur J Radiol, 2019; 120; 108692
14. Hwang EJ, Hong JH, Lee KH, Deep learning algorithm for surveillance of pneumothorax after lung biopsy: A multicenter diagnostic cohort study: Eur Radiol, 2020; 30(7); 3660-71
15. Zhao Y, Wang X, Wang Y, Zhu Z, Logistic regression analysis and a risk prediction model of pneumothorax after CT-guided needle biopsy: J Thorac Dis, 2017; 9(11); 4750-57
16. Wang Y, Liu W, Yu Y, Potential value of CT radiomics in the distinction of intestinal-type gastric adenocarcinomas: Eur Radiol, 2020; 30(5); 2934-44
17. Miskin N, Qin L, Matalon SA, Stratification of cystic renal masses into benign and potentially malignant: Applying machine learning to the bosniak classification: Abdom Radiol (NY), 2021; 46(1); 311-18
18. Couronné R, Probst P, Boulesteix AL, Random forest versus logistic regression: A large-scale benchmark experiment: BMC Bioinformatics, 2018; 19(1); 270
19. Wu CC, Maher MM, Shepard JA, CT-guided percutaneous needle biopsy of the chest: Preprocedural evaluation and technique: Am J Roentgenol, 2011; 196(5); W511-14
20. Yeow KM, See LC, Lui KW, Risk factors for pneumothorax and bleeding after CT-guided percutaneous coaxial cutting needle biopsy of lung lesions: J Vasc Interv Radiol, 2001; 12(11); 1305-12
21. Nour-Eldin NE, Naguib NN, Tawfik AM, Outcomes of an algorithmic approach to management of pneumothorax complicating thermal ablation of pulmonary neoplasms: J Vasc Interv Radiol, 2011; 22(9); 1279-86
22. Sarica A, Cerasa A, Quattrone A, Random forest algorithm for the classification of neuroimaging data in Alzheimer’s disease: A systematic review: Front Aging Neurosci, 2017; 6(9); 329
23. DeLong ER, DeLong DM, Clarke-Pearson DL, Comparing the areas under two or more correlated receiver operating characteristic curves: A nonparametric approach: Biometrics, 1988; 44(3); 837-45
24. Aktas AR, Gozlek E, Yazkan R, Transthoracic biopsy of lung masses: Non technical factors affecting complication occurrence: Thorac Cancer, 2015; 6(2); 151-58
25. Topal U, Ediz B, Transthoracic needle biopsy: Factors effecting risk of pneumothorax: Eur J Radiol, 2003; 48(3); 263-67
26. Chami HA, Faraj W, Yehia ZA, Predictors of pneumothorax after CT-guided transthoracic needle lung biopsy: The role of quantitative CT: Clin Radiol, 2015; 70(12); 1382-87
27. Takeshita J, Masago K, Kato R, CT-guided fine-needle aspiration and core needle biopsies of pulmonary lesions: A single-center experience with 750 biopsies in Japan: Am J Roentgenol, 2015; 204(1); 29-34
28. Ko JP, Shepard JO, Drucker EA, Factors influencing pneumothorax rate at lung biopsy: Are dwell time and angle of pleural puncture contributing factors?: Radiology, 2001; 218(2); 491-96
29. Lim WH, Park CM, Yoon SH, Time-dependent analysis of incidence, risk factors and clinical significance of pneumothorax after percutaneous lung biopsy: Eur Radiol, 2018; 28(3); 1328-37
30. Yin ZY, Lin ZY, Wang Y, Risk factors of complications after CT-guided percutaneous needle biopsy of lumps near pulmonary hilum: J Huazhong Univ Sci Technolog Med Sci, 2015; 35(2); 278-82
31. Niu XK, Bhetuwal A, Yang HF, CT-guided core needle biopsy of pleural lesions: Evaluating diagnostic yield and associated complications: Korean J Radiol, 2015; 16(1); 206-12
32. Drumm O, Joyce EA, de Blacam C, CT-guided lung biopsy: Effect of biopsy-side down position on pneumothorax and chest tube placement: Radiology, 2019; 292(1); 190-96
33. Lee SM, Park CM, Lee KH, C-arm cone-beam CT-guided percutaneous transthoracic needle biopsy of lung nodules: Clinical experience in 1108 patients: Radiology, 2014; 271(1); 291-300
34. Kim JI, Park CM, Lee SM, Goo JM, Rapid needle-out patient-rollover approach after cone beam CT-guided lung biopsy: Effect on pneumothorax rate in 1,191 consecutive patients: Eur Radiol, 2015; 25(7); 1845-53
35. Hiraki T, Mimura H, Gobara H, Incidence of and risk factors for pneumothorax and chest tube placement after CT fluoroscopy-guided percutaneous lung biopsy: Retrospective analysis of the procedures conducted over a 9-year period: Am J Roentgenol, 2010; 194(3); 809-14
Figures
Figure 1. Flow diagram for the development and validation data.Figure 2. Measurement methods. (A) Axial chest CT image in a 61-year-old male patient demonstrates a solid nodule in the right upper lobe. The lesion size is measured along the maximum short-axis diameter (white dotted line). The lesion depth is measured from the costal pleura to the nearest edge of the lesion (yellow double arrows). The length of the aerated lung traversed by the needle is measured from the pleural puncture point to the edge of lesion along the needle path (red double arrows). The angle of pleural puncture is the smallest angle between a line along the needle route and a tangential line to the pleura (white arc). (B) Axial chest CT image in a 78-year-old male patient demonstrates a cavitary lesion in the right upper lobe. The biopsy needle passed through the pleural indentation (white arrow). (C) Axial chest CT image demonstrates the pneumothorax measurement. The longest distance between parietal pleura and visceral pleura (white line).Figure 3. Feature selection. (A) Ranking of important risk factors for the prediction of pneumothorax. (B) Predictive performance (AUCs) of the RF models at each number of risk factors in the development data and the external validation date.Figure 4. Receiver operating characteristic curves (ROCs) and the areas under the curves (AUCs) of models in (A) the development data based on 15 risk factors versus 7 critical risk factors, (B) the validation data based on 15 risk factors versus 7 critical risk factors. Tables
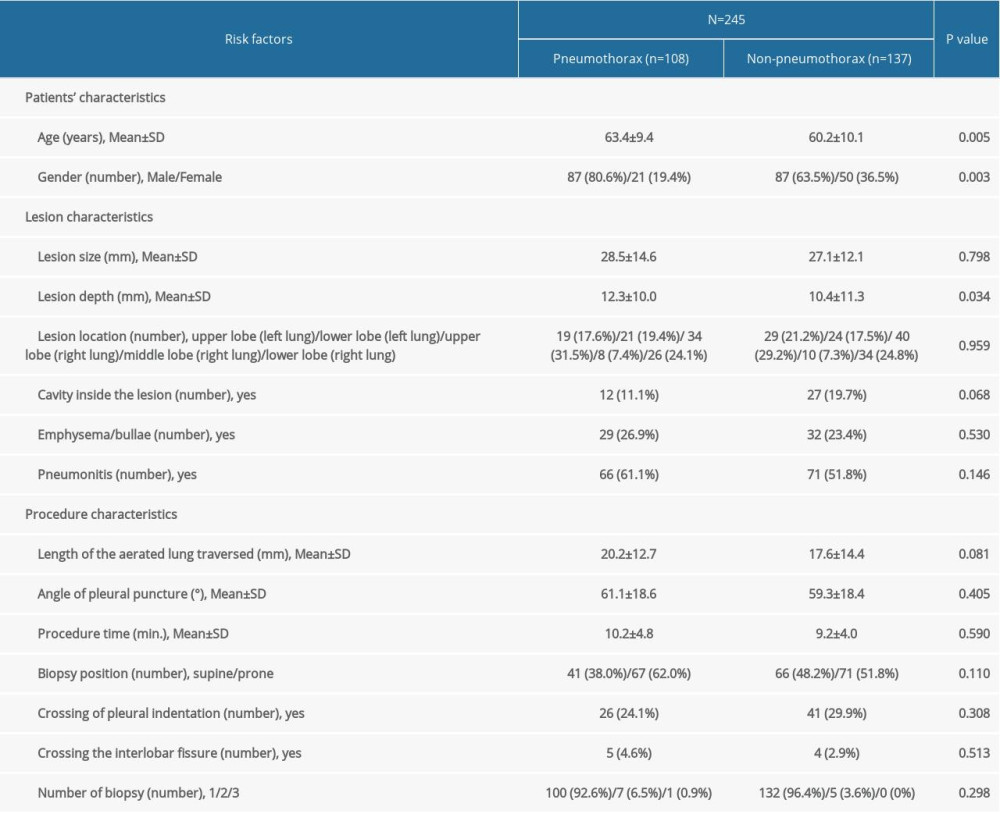 Table 1. Characteristics of development data.
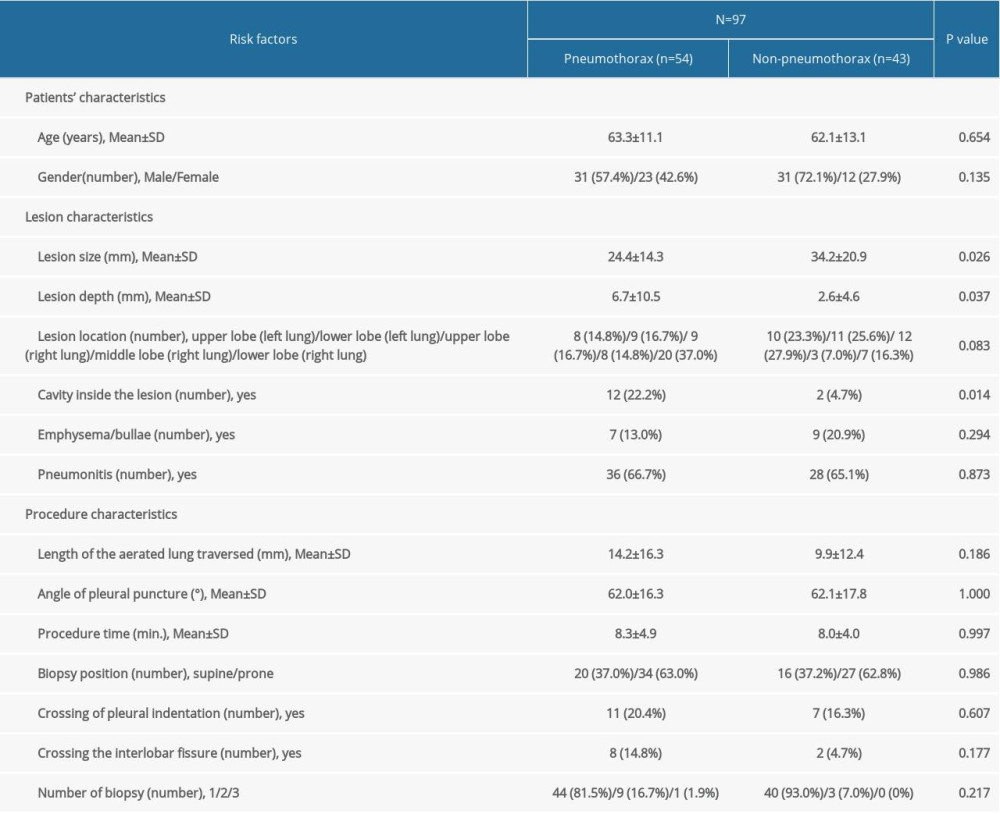 Table 2. Characteristics of validation data.
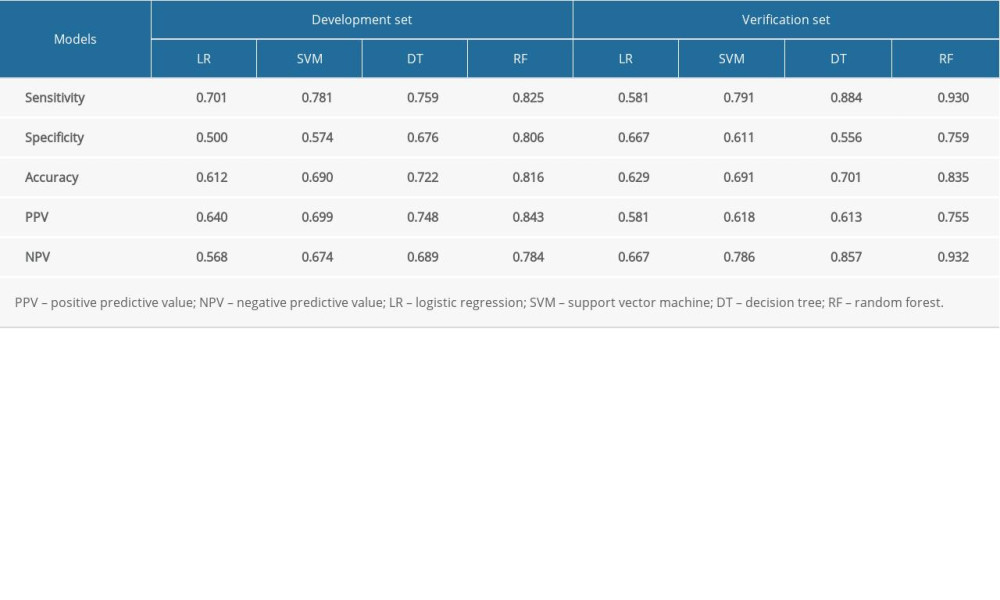 Table 3. Prediction performance of models based on 15 risk factors.
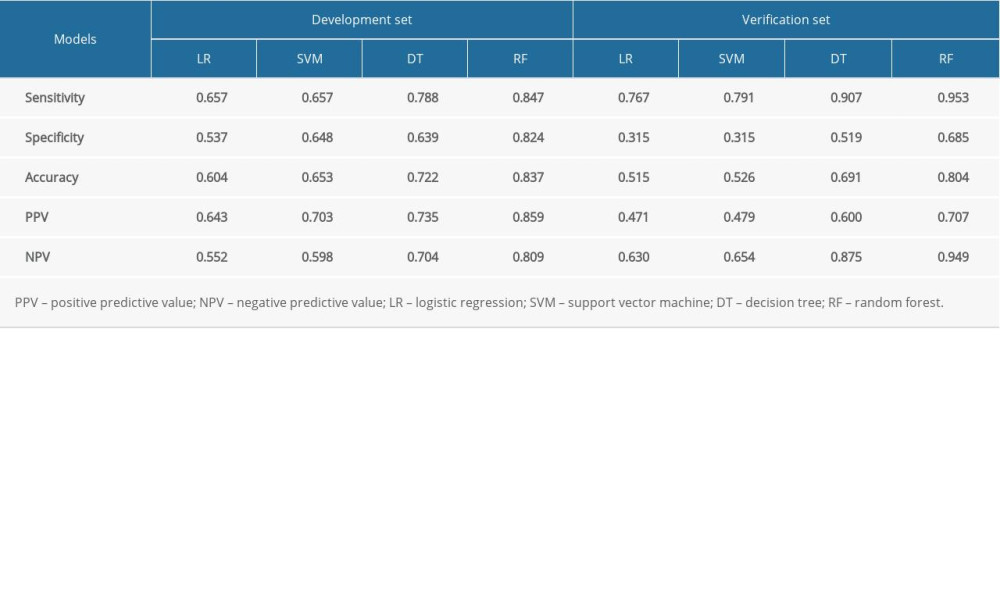 Table 4. Prediction performance of models on 7 risk factors.
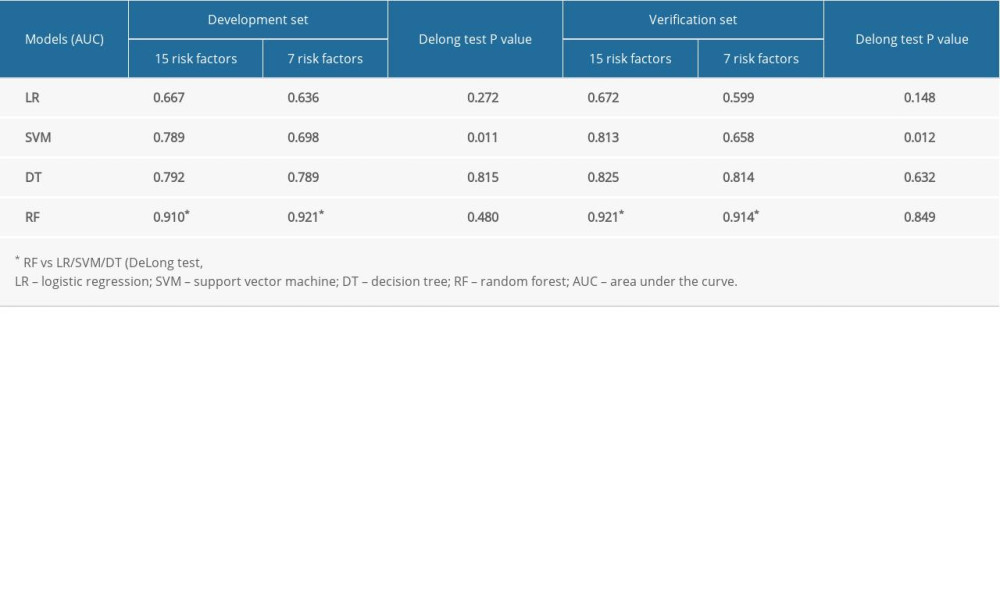 Table 5. Prediction performance of models on 15 vs 7 risk factors.Table 1. Characteristics of development data.Table 2. Characteristics of validation data.Table 3. Prediction performance of models based on 15 risk factors.Table 4. Prediction performance of models on 7 risk factors.Table 5. Prediction performance of models on 15 vs 7 risk factors.
 In Press
06 Mar 2024 : Clinical Research
Comparison of Outcomes between Single-Level and Double-Level Corpectomy in Thoracolumbar Reconstruction: A ...Med Sci Monit In Press; DOI: 10.12659/MSM.943797
21 Mar 2024 : Meta-Analysis
Economic Evaluation of COVID-19 Screening Tests and Surveillance Strategies in Low-Income, Middle-Income, a...Med Sci Monit In Press; DOI: 10.12659/MSM.943863
10 Apr 2024 : Clinical Research
Predicting Acute Cardiovascular Complications in COVID-19: Insights from a Specialized Cardiac Referral Dep...Med Sci Monit In Press; DOI: 10.12659/MSM.942612
06 Mar 2024 : Clinical Research
Enhanced Surgical Outcomes of Popliteal Cyst Excision: A Retrospective Study Comparing Arthroscopic Debride...Med Sci Monit In Press; DOI: 10.12659/MSM.941102
Most Viewed Current Articles
17 Jan 2024 : Review article
Vaccination Guidelines for Pregnant Women: Addressing COVID-19 and the Omicron VariantDOI :10.12659/MSM.942799
Med Sci Monit 2024; 30:e942799
14 Dec 2022 : Clinical Research
Prevalence and Variability of Allergen-Specific Immunoglobulin E in Patients with Elevated Tryptase LevelsDOI :10.12659/MSM.937990
Med Sci Monit 2022; 28:e937990
16 May 2023 : Clinical Research
Electrophysiological Testing for an Auditory Processing Disorder and Reading Performance in 54 School Stude...DOI :10.12659/MSM.940387
Med Sci Monit 2023; 29:e940387
01 Jan 2022 : Editorial
Editorial: Current Status of Oral Antiviral Drug Treatments for SARS-CoV-2 Infection in Non-Hospitalized Pa...DOI :10.12659/MSM.935952
Med Sci Monit 2022; 28:e935952