13 August 2021: Clinical Research
Brain Functional Connectivity Changes in Patients with Acute Eye Pain: A Resting-State Functional Magnetic Resonance Imaging (fMRI) Study
Yan-Chang Yang1ABCEF*, Guo-Qian Cai2AB, Qi-Chen Yang3CD, Biao Li4DF, Qian-Min Ge4EF, Qiu-Yu Li4DF, Wen-Qing Shi4F, You-Lan Min4F, Rong-Bin Liang5F, Yi Shao5ACGDOI: 10.12659/MSM.930588
Med Sci Monit 2021; 27:e930588


Abstract
BACKGROUND: By using functional magnetic resonance imaging (fMRI), we aimed to study the changes in potential brain function network activity in patients with acute eye pain. Also, by using the voxel-wise degree centrality (DC) method, we aimed to explore the relationship between spontaneous brain activity and the clinical features of patients with acute eye pain.
MATERIAL AND METHODS: A total of 15 patients with acute eye pain (5 women and 10 men; EP group) and 15 healthy controls (5 women and 10 men; HC group), were scanned by fMRI. The DC method was used to evaluate changes in spontaneous brain activity. Receiver operating characteristic (ROC) curves were analyzed, and Pearson correlation analysis was used to study the relationship between DC values and clinical manifestations in different regions of brain.
RESULTS: The area of the left limbic lobe showed a reduction in DC value in patients in the EP group. DC values were elevated in the left cerebellum posterior lobe, left inferior parietal lobule, left inferior temporal gyrus, left precuneus, and right cerebellum posterior lobe in the EP group. The visual analog scale value of the eyes in the EP group was negatively correlated with the left limbic lobe signal value and positively correlated with the left inferior parietal lobule signal value. Further, the scores of the hospital anxiety and depression scale and DC value of the left limbic lobe were negatively correlated.
CONCLUSIONS: Compared with the HC group, patients with acute eye pain had abnormal patterns of intrinsic brain activity in different brain regions, which may help reveal the potential neural mechanisms involved in eye pain.
Keywords: Eye Pain, functional neuroimaging, Magnetic Resonance Imaging, Brain, Brain Mapping, Connectome, Eye, Nerve Net, ROC Curve, Rest
Background
Eye pain is the most common eye symptom in patients with ocular diseases, and many lesions of the eyeball and its adnexa can cause significant eye pain. Eye pain is not only related to symptoms of the eye, but can also be accompanied by headache [1]. Keratitis or corneal ulcers can cause severe eye pain. Studies have shown that the probability of human infection with infectious keratitis is 0.148% [2]. In addition, studies have shown that patients who experience keratectomy often have corneal pain symptoms [3]. The cornea is a structure with rich innervation in the human body, and its main sensory and nutrient nerves are the trigeminal ocular branches. Currently, the main method of treating keratitis or corneal ulcers is the use of antibiotics; however, there is no effective way to alleviate the eye pain associated with these conditions [4].
The direct cause of corneal pain is damage to the corneal nerves that triggers neural sensory networks, which are associated with cluster headaches [1]. Experimental studies in mice have shown that the pain caused by damaged corneal nerve fibers can activate neurons in the anterior cingulate cortex, rostroventral medulla, and insular cortex [5]. Research has also found that corneal pain can be related to local activation of the primary somatosensory cortex [6]. In addition, studies have confirmed that patients with chronic eye pain may have psychological or mental disorders [7,8], such as anxiety and depression [9].
Resting-state functional magnetic resonance imaging (rs-fMRI) was first developed in the 1990s and is becoming an increasingly important imaging technique because it can perform functional imaging of brain tissue [10]. FMRI has a wide range of applications. Blood oxygen level-dependent imaging (BOLD), diffusion tensor imaging, and magnetic resonance spectrum analysis can be used in fMRI studies. At present, rs-fMRI is widely used in a variety of diseases, such as epilepsy [11], Alzheimer’s disease [12], schizophrenia [13], and attention-deficit hyperactivity disorder [14]. However, the rs-fMRI method is a type of acquisition technology and cannot provide data related to the connectivity of the whole brain network. The pathophysiological basis underlying whole brain information processing remains unclear.
Voxel-wise degree centrality (DC) is a voxel-level graph-based network measurement tool. This technique takes each element as a node and then calculates the number of nodes connected to the rest of the nodes, indirectly reflecting the location and importance of the nodes or brain regions in the brain network. DC represents the direct connection sum of a given voxel to the rest of the entire brain voxel without the need for a priori nodes or regions of interest [15]. Therefore, the node with a high DC value can be regarded as the hub of information integration; that is to say, the node with high DC value is a node with substantial direct connection with other nodes. This technique is often used as a network measurement to explore the pathophysiological mechanisms of ocular diseases such as strabismus [16] and glaucoma [17]. The aim of this study was to explore the relationship between spontaneous brain activity and clinical characteristics in patients with acute eye pain and the differences in functional connection between healthy subjects and patients with eye pain.
Material and Methods
PARTICIPANTS:
In this study, we recruited 15 patients with acute eye pain (EP group) and 15 healthy controls (HC group) from The First Affiliated Hospital of Nanchang University. There were 10 men and 5 women in both groups. The groups were matched for age, sex, and education level.
The including criteria of all participants were as follows: (1) able to undergo MRI scanning; (2) no other systemic diseases; (3) no mental illness (anxiety, depression, bipolar disorder, or other mental disorders), and (4) no cerebral infarction.
Inclusion criteria for patients in the EP group were as follows: (1) acute condition with corneal ulcer or keratitis and (2) without other types of eye diseases. Exclusion criteria for the EP group were as follows: (1) long-term, chronic eye pain (>3 months); (2) eye pain caused by glaucoma or trauma; (3) with severe, related complications; (4) history of use of painkillers; (5) with pain. Inclusion criteria for the HC group were as follows: (1) no ocular diseases and (2) corrected visual acuity (>1.0).
The study was approved by the medical ethics committee of the First Affiliated Hospital of Nanchang University, and strictly followed the principles of the Declaration of Helsinki.
PARAMETERS FOR FMRI:
Participants in the study were scanned with a Trio 3-Tesla MRI scanner. To obtain the structure image, we used parameters to modulate the gradient echo sequence, as shown in Table 1.
FMRI DATA ANALYSIS:
We used DPARSFA 3.0 and SPM8 to process the data. The procedure for pre-processing included the following steps: (1) the first 10 volumes for each participant was discarded because of the participant’s adaptability to the scanning noise and the signal instability; (2) the translation (mm) and rotation (degree) of each participant were estimated to obtain the exercise time after head movement correction; (3) covariate effects of non-neuronal BOLD fluctuations (including cerebrospinal fluid and white matter signals) were rejected by using a linear regression process; (4) the 3×3×3 mm3 full-width images were smoothed to 6 mm, and we used the echo plane image template to standardize the fMRI images to satisfy the Montreal Neurological Institute (MNI) space criteria.
DEGREE CENTRALITY:
Each voxel was utilized as a node, and the related voxels were utilized as edges to generate a voxel functional network for each participant. Preprocessed functional images were used for voxel correlation analysis in the condition of DPARSFA’s default brain barrier (with a voxel size of 3×3×3 mm3 and a resolution of 61×73×61 in the MIN-152 standard space). In addition, the Pearson correlation between the time courses of any pair of voxels was calculated, resulting in a 70831×70831 correlation matrix. Based on the individual voxel functional network, we calculated the significant super-threshold correlation number for each participant as a DC value. The relevant calculation equation was Zi=DCi-meanall/stdall, where Zi referred to the z-score of the i-th voxel, DCi referred to the DC value of the i-th voxel, and stdall referred to the standard deviation of DC values of all voxels in brain hood [18].
DATA ANALYSIS:
SPSS version 24.0 was used to perform independent sample
Results
DEMOGRAPHICS AND VISUAL MEASUREMENTS:
Comparison of clinical data between the EP group and the HC group revealed no significant differences in terms of age (P=0.796) or weight (P=0.845) (Table 2).
DC VALUES OF DIFFERENT BRAIN REGIONS:
The DC value of the left limbic lobe in the EP group was significantly lower than that of the HC group. The DC values of the left cerebellum posterior lobe, right cerebellum posterior lobe, left inferior temporal gyrus, left inferior parietal lobule, left precuneus were significantly elevated in the EP group (Figure 1A, Table 3). The mean change in DC of patients in the EP group and HC group are shown in Figure 1B.
ROC CURVE ANALYSIS:
The DC values in different regions of the brain were significantly different in the EP and HC groups, showing that DC values could be useful as markers for distinguishing between patients with eye pain and healthy controls. Results of the area under the curve (AUC) analyses were as follows: the left cerebellum posterior lobe (AUC 0.767); right cerebellum posterior lobe (AUC 0.770); left precuneus (AUC 0.749); left inferior temporal gyrus (AUC 0.796) (EP>HC) (Figure 2A), and left limbic lobe (AUC 0.749) (EP <HC) (Figure 2B).
CORRELATION ANALYSIS:
The visual analog scale (VAS) value of the eyes in the EP group was negatively correlated with the left limbic lobe signal value (r=−0.789; P=0.001) and positively correlated with the left inferior parietal lobule signal value (r=0.561; P=0.046). All participants completed the hads. We used SPSS version 24.0 to analyze the correlation between the values of HADS scores and DC. The results showed that the HADS scores and the DC value of left limbic lobe were negatively correlated (r=−0.837; P=0.001), as shown in Figure 3.
Discussion
ANALYSIS OF THE REDUCTION IN DC VALUE IN PATIENTS WITH EP:
The limbic lobe refers to the inner side of the cerebral hemisphere and the periorbital structure of the brainstem junction and the corpus callosum, consisting of the subcallosal area, endplate gyrus, cingulate gyrus, hippocampal convolution, hippocampus, and the dentate gyrus [22]. In a previous study, Broca studied the brains of primates and found that the limbic lobe was associated with olfaction; however, more recent studies have found that this lobe carries out many more functions than first thought and represents an important center for regulating visceral activity [23]. Because the limbic lobe is closely related to the insular lobe, temporal pole, orbital gyrus of the cerebral cortex, and the amygdala under the cortex in terms of structure and function, some authors have referred to these structures as the limbic system [24]. The limbic system is related to memory and emotional output. Its main functions are that the hippocampus, as part of the Papez circuit, participates in memory [25] and the amygdala plays roles in emotional response, memory, and drive. The main clinical manifestations of lesions in the limbic system are epilepsy, confusion, and cognitive impairment [26]. In our present study, we found that the DC value of the left limbic lobe (LLL) of patients in the EP group was significantly lower than that of the HC group (see spot no. 6 in Figure 4). We suggest that EP may cause dysfunction of the LLL, which may explain the emotional irritability, instability, and headache of patients with eye pain. In addition, according to the correlation analysis shown in Figure 3C, we can hypothesize that LLL is related to anxiety and depression.
We also found that the VAS value of the eyes of the EP group showed a negative correlation with the signal value of the LLL (r=−0.789;
ANALYSIS OF THE INCREASED DC IN PATIENTS WITH EYE PAIN:
The posterior part of the cerebellum can receive signals from the cerebral cortex to participate in motor coordination [27], manifesting in the formation and proficiency of delicate movements. Injury to the posterior cerebellum causes a reduction in muscle tension and coordination of voluntary movements [28], which manifests mainly in the accuracy and coordination of movement. Studies have shown that the cerebellum is responsible for performing accurate eye movements [29] and dealing with visual movements. Purkinje cells transmit the only output of the cerebellar cortex to the deep cerebellar nucleus [30], which can cause ataxia when the Purkinje cells are injured. We found that the DC in the cerebellar posterior lobe was increased in patients in the EP group (see spots no. 4 and 5 in Figure 4). This suggests that there may be dysfunction of the posterior cerebellar lobe in patients with eye pain. We suggest that the enhancement of cerebellar functional connections may be related to eye pain-related sensory inputs. Recurrent headache, dizziness, and nausea may therefore be related to an abnormal posterior cerebellar lobe.
The inferior temporal gyrus is located below the temporal transverse gyrus. This area participates in visual processing and may also be related to facial perception and data identification. The occipitotemporal gyrus is related to the recognition of visual objects [31]. The inferior temporal cortex includes the middle and inferior temporal gyrus and can process visual stimuli and participate in memory and recognition of objects [32]. That is to say, this region recognizes the color and shape of an object and stores the information and memory related to the object, so as to be able to identify the object. Prosopagnosia is a disease in which patients cannot recognize and distinguish faces. A previous study reported the case of a patient who was able to identify objects normally but could not recognize faces; this patient was subsequently found to have a lesion on the right fusiform gyrus [33]. In other words, part of the inferior temporal gyrus had lesions, a main causes of the symptoms of such patients [34]. We think the reason eye pain can increase the activity of the left inferior temporal gyrus may the compensatory mechanism of brain visual abnormality in patients with eye pain (spot no. 3 in Figure 4).
The inferior parietal lobe (IPL) is located below the interparietal fissure of the parietal lobe and includes the angular gyrus and supramarginal gyrus. The IPL is involved in the interpretation of sensory information and the perception of facial stimuli [35]. It is also related to semantic processing [36] and mathematical operations [37]. Gerstmann syndrome can be caused by IPL lesions, particularly in the dominant hemisphere; the symptoms of this condition are left and right confusion, finger agnosia, dyslexia, dyscalculia, and contralateral hemianopia [38]. It has been reported that most patients with schizophrenia exhibit an abnormal structure of the IPL [39], such as reduced gray matter volume and thinned cortex [40], and that these patients have most of the above symptoms. In addition, apraxia can be caused by lesions of the supramarginal gyrus and angular gyrus [41], which manifests in the absence of paralysis and deep sensory disturbances, whereby the limbs have an operational barrier [42]. In addition, the left inferior parietal lobe (LIPL) contributes to the recognition of visual words [43]. In our present study, we found that the DC value of the LIPL in patients in the EP group was significantly elevated, suggesting that eye pain may cause LIPL dysfunction (spot no. 2 in Figure 4).
We also observed that the VAS value of the eyes in the EP group showed a positive correlation with the signal value of the left inferior parietal lobule (r=0.561;
The precuneus is in the medial part of the parietal lobe. This is an important area for visual spatial integration, episodic memory recovery, and self-awareness [44]. The impact of alterations of different brain regions is shown in Table 4. Neuroimaging studies have shown that the structure and function of the precuneus are abnormal in patients with obsessive-compulsive disorder [45], while other studies have reported a positive correlation between the gray matter of the left precuneus and harmful symptoms [46]. Studies have also shown that auditory verbal hallucinations in patients with schizophrenia can be associated with changes in the structure and function of the left precuneus [47]. Other studies have shown that the posterior cingulate and precuneus are the initial locations for the development of Alzheimer’s disease [48]. In addition, the precuneus is the judgment center of verbal politeness [49] and can assess inconsistencies between tactile and visual texture information [50]. A summary of previous studies is presented in Table 5. In the present study, we found a significant elevation in DC value of the left precuneus of patients in the EP group, suggesting that eye pain may lead to over activation of left precuneus activity (spot no. 1 in Figure 4). Therefore, we speculate that patients with eye pain will have hyperfunction of visual spatial integration, and dizziness, vomiting, and obsessive-compulsive personality, among other symptoms. Our team has made significant progress in this area in previous research [51–57].
LIMITATIONS:
It should be noted that there are still many limitations in this study. The sample size of this study is small, and there may be deviation; therefore, we need to use a larger sample size to explore these concepts in future studies. Also, because the subjects were all from the same hospital, there may be collection bias.
Conclusions
In conclusion, this study showed that patients with eye pain had abnormal spontaneous activity in many brain regions compared with healthy control participants, which provided insight into the neurological variation in patients with eye pain and facilitated the interpretation of the potential mechanisms underlying eye pain. Patients with eye pain should not only pay attention to physical therapy; psychological therapy should also be involved as early as possible. We hope that our results can be beneficial to the treatment of patients with eye pain.
Figures
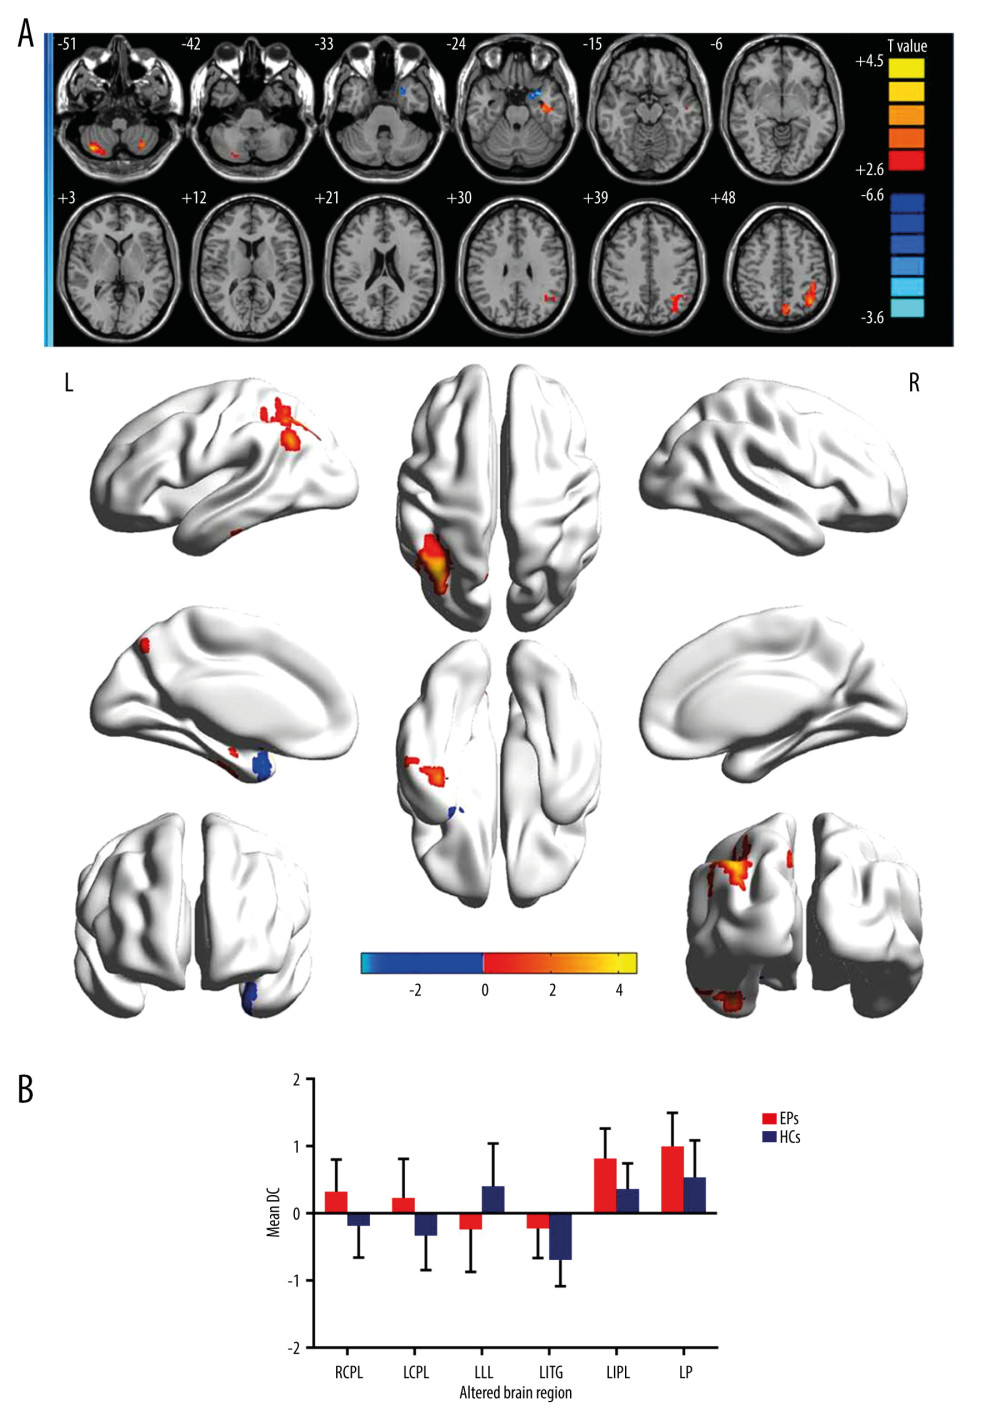 Figure 1. (A) Voxel comparison of degree centrality (DC) in the eye pain (EP) and healthy control (HC) groups: significant differences in DC were observed in the left limbic lobe, right cerebellum posterior lobe, left cerebellum posterior lobe, left inferior temporal gyrus, left inferior parietal lobule, and left precuneus. The red area indicates a higher DC value and the blue color indicates a lower DC value. Multiple comparisons were performed using Gaussian random field theory (z>2.3, column by column correction, P<0.05), P<0.05. (B) Average DC values between EP and HC groups. DC – degree centrality; EP – eye pain; HC – healthy control; L – left; R – right; RCPL – right cerebellum posterior lobe; LCPL – left cerebellum posterior lobe; LLL – left limbic lobe; LITG – left inferior temporal gyrus; LIPL – left inferior parietal lobe; LP – left precuneus.
 ![Receiver operating characteristic curve analysis of the mean DC values for altered brain regions. (A) The area under the receiver operating characteristic (ROC) curve were 0.770 for right cerebellum posterior lobe (RCPL) (P<0.001; 95% confidence interval [CI]: 0.668–0.873); left cerebellum posterior lobe (LCPL) 0.767 (P<0.001; 95%CI: 0.663–0.870); left inferior temporal gyrus (LITG) 0.796 (P<0.001; 95%CI: 0.699–0.893); left inferior parietal lobe (LIPL) 0.783 (P<0.001; 95%CI: 0.683–0.883); and left precuneus (LP) 0.749 (p<0.001; 95%CI: 0.642–0.855). (B) The area under the ROC curve (AUC) was 0.749 (P<0.001; 95%CI: 0.644–0.854) for the left limbic lobe (LLL).](https://jours.isi-science.com/imageXml.php?i=medscimonit-27-e930588-g002.jpg&idArt=930588&w=1000) Figure 2. Receiver operating characteristic curve analysis of the mean DC values for altered brain regions. (A) The area under the receiver operating characteristic (ROC) curve were 0.770 for right cerebellum posterior lobe (RCPL) (P<0.001; 95% confidence interval [CI]: 0.668–0.873); left cerebellum posterior lobe (LCPL) 0.767 (P<0.001; 95%CI: 0.663–0.870); left inferior temporal gyrus (LITG) 0.796 (P<0.001; 95%CI: 0.699–0.893); left inferior parietal lobe (LIPL) 0.783 (P<0.001; 95%CI: 0.683–0.883); and left precuneus (LP) 0.749 (p<0.001; 95%CI: 0.642–0.855). (B) The area under the ROC curve (AUC) was 0.749 (P<0.001; 95%CI: 0.644–0.854) for the left limbic lobe (LLL).
Figure 2. Receiver operating characteristic curve analysis of the mean DC values for altered brain regions. (A) The area under the receiver operating characteristic (ROC) curve were 0.770 for right cerebellum posterior lobe (RCPL) (P<0.001; 95% confidence interval [CI]: 0.668–0.873); left cerebellum posterior lobe (LCPL) 0.767 (P<0.001; 95%CI: 0.663–0.870); left inferior temporal gyrus (LITG) 0.796 (P<0.001; 95%CI: 0.699–0.893); left inferior parietal lobe (LIPL) 0.783 (P<0.001; 95%CI: 0.683–0.883); and left precuneus (LP) 0.749 (p<0.001; 95%CI: 0.642–0.855). (B) The area under the ROC curve (AUC) was 0.749 (P<0.001; 95%CI: 0.644–0.854) for the left limbic lobe (LLL). 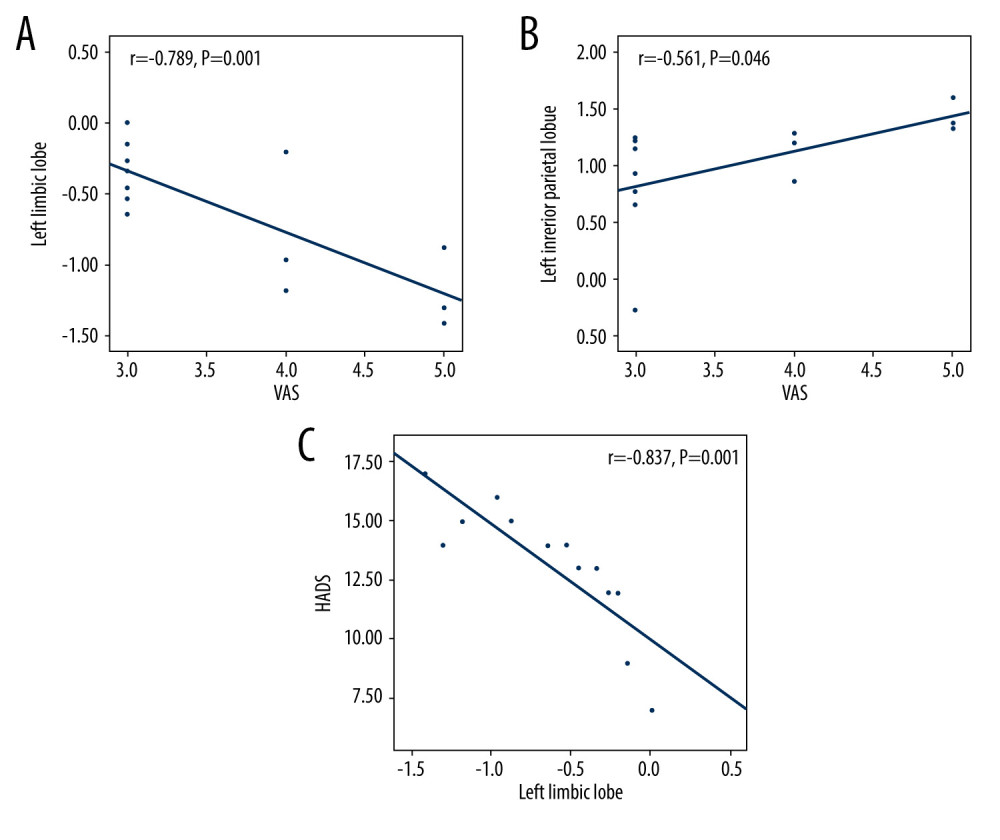 Figure 3. The correlation of visual analog scale, hospital anxiety and depression scale, and signal value in different brain regions. (A) The visual analog scale (VAS) value of the eyes of the eye pain (EP) group showed a negative correlation with the signal value of the left limbic lobe (r=−0.789, P=0.001). (B) The VAS value of the eyes of the EP group showed a positive correlation with the signal value of the left inferior parietal lobule (r=0.561, P=0.046). (C) The HADS value of the eyes of the EP group showed a negative correlation with the signal value of the left limbic lobe (r=−0.837; P=0.001).
 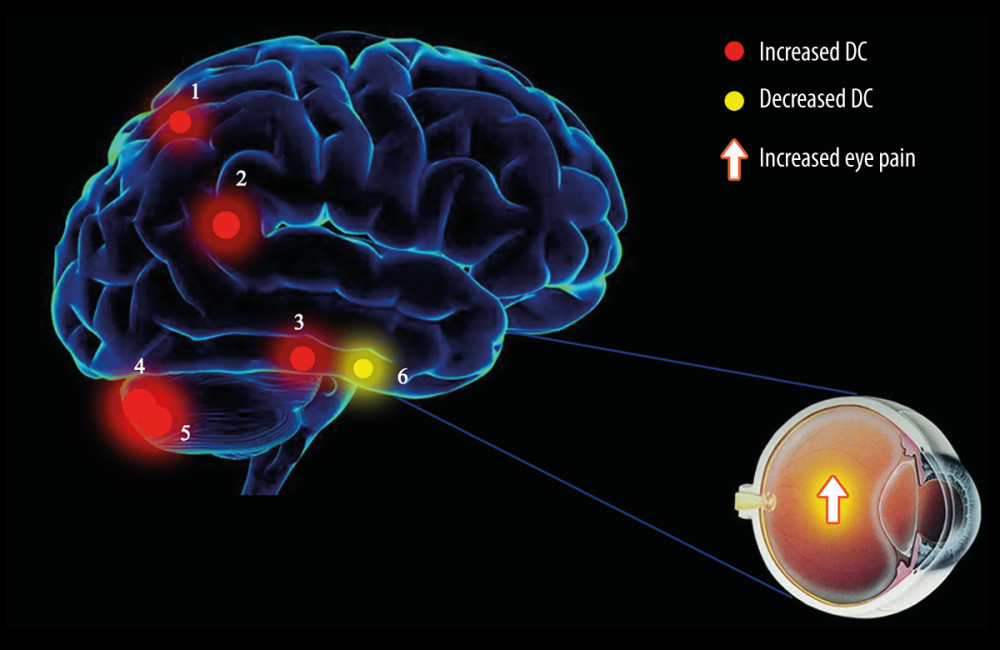 Figure 4. The degree centrality results of brain activity in the eye pain (EP) group. Compared with the healthy control (HC) group, the DC of patients in the EP group in the following regions were elevated: 1, left precuneus (t=3.6715); 2, left inferior parietal lobule (t=3.8899); 3, left inferior temporal gyrus (t=3.7357); 4, left cerebellum posterior lobe (t=4.5262); and 5, right cerebellum posterior lobe (t=4.4116). Region 6, the left limbic lobe (t=−3.5969), was decreased. The sizes of the spots denote the degree of quantitative changes.
 Tables
Table 1. Information on resting-state functional magnetic resonance imaging parameters.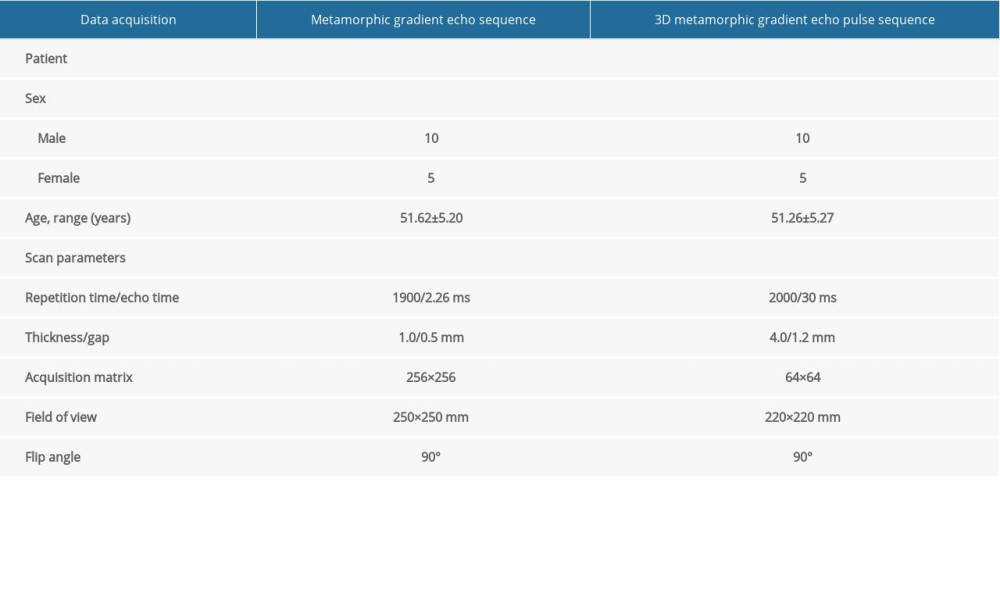 Table 2. Demographics and clinical measurements.
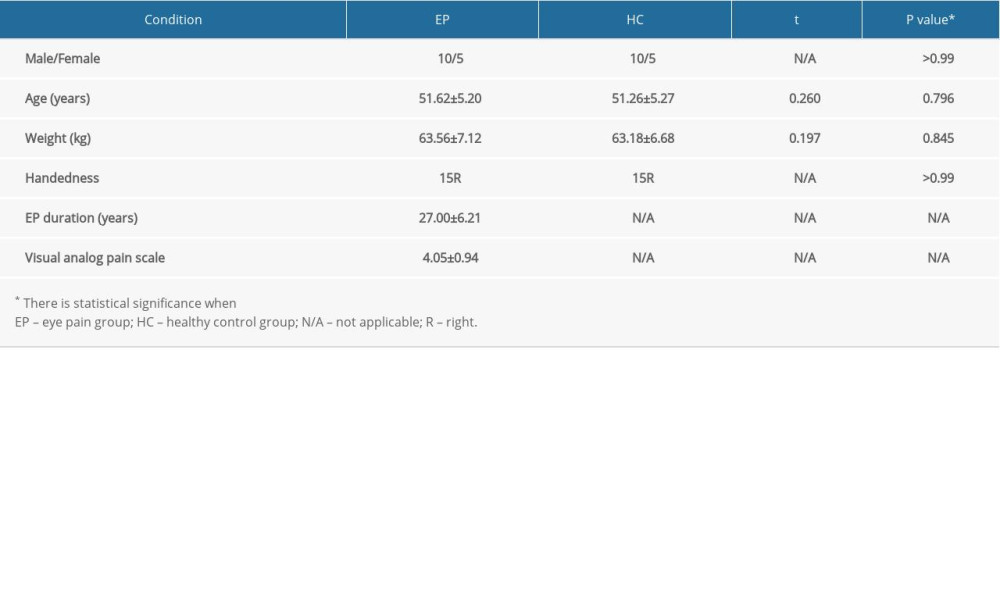 Table 3. Significant differences in degree centrality between different brain regions of eye pain and healthy control groups.
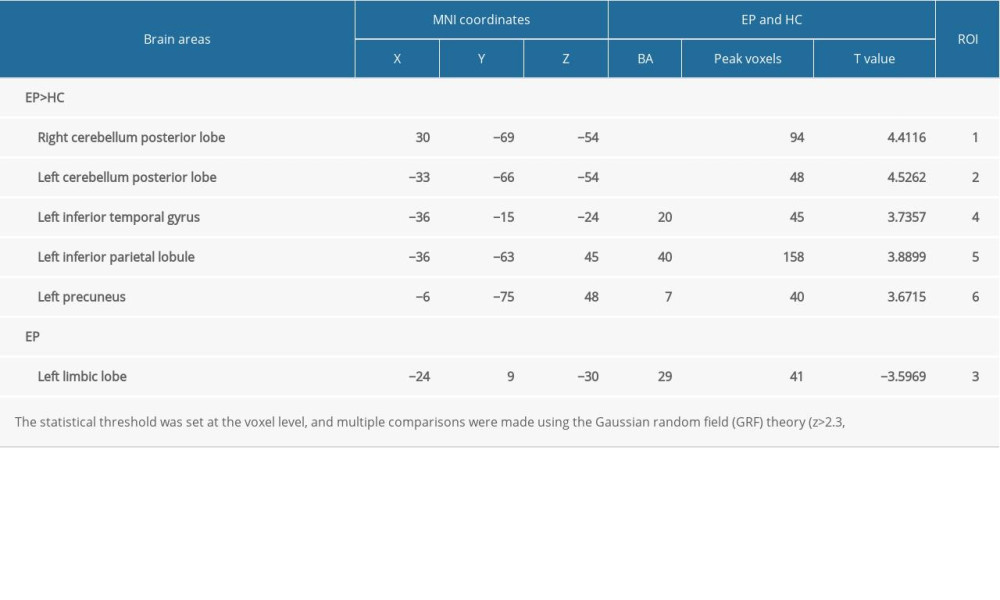 Table 4. Brain regions alternations and potential impact.
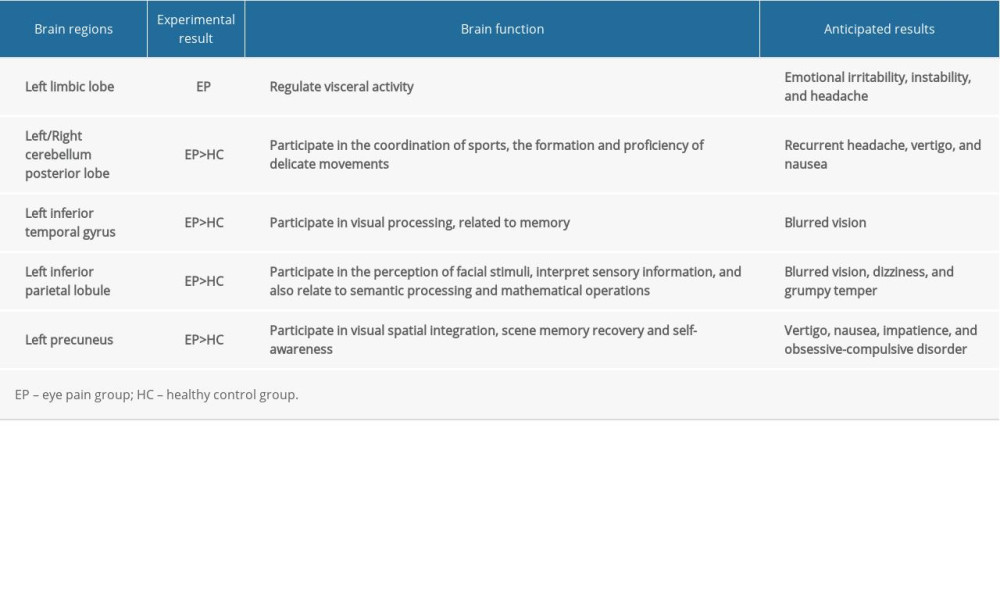 Table 5. DC method applied in ophthalmological diseases.
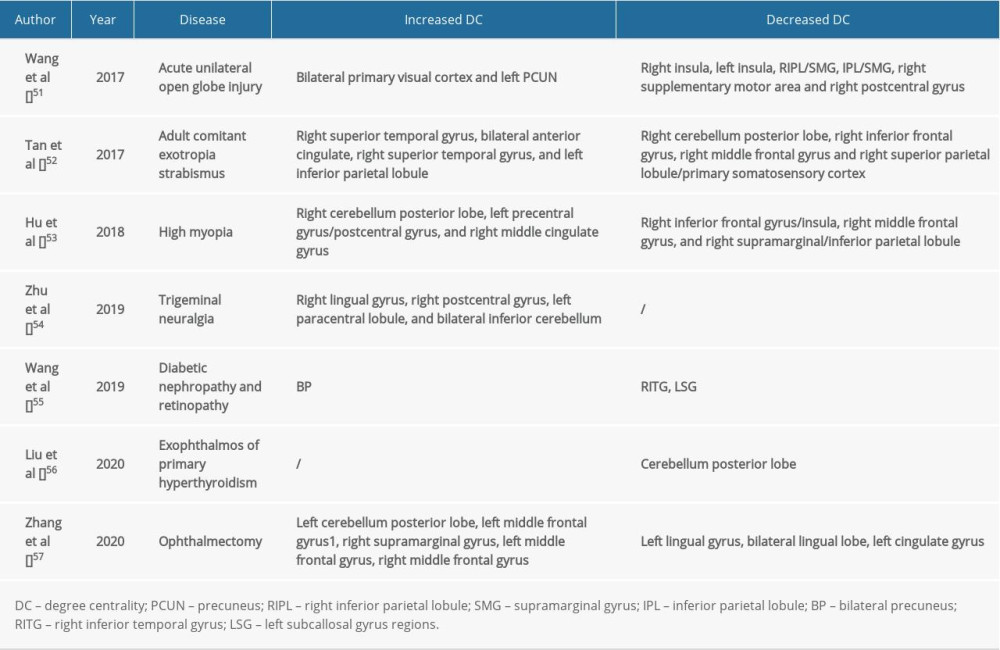
References
1. Sandrini G, Alfonsi E, Ruiz L, Impairment of corneal pain perception in cluster headache: Pain, 1991; 47(3); 299-304
2. Cao J, Yang Y, Yang W, Prevalence of infectious keratitis in Central China: BMC Ophthalmol, 2014; 14(1); 43
3. Kim SK, Hong JP, Nam SM, Analgesic effect of preoperative topical nonsteroidal antiinflammatory drugs on postoperative pain after laser-assisted subepithelial keratectomy: J Cataract Refract Surg, 2015; 41(4); 749-55
4. Lalitha P, Manoharan G, Karpagam R, Trends in antibiotic resistance in bacterial keratitis isolates from South India: Br J Ophthalmol, 2017; 101(2); 108-13
5. Xiang Y, Zhou W, Wang P, Alkali burn induced corneal spontaneous pain and activated neuropathic pain matrix in the central nervous system in mice: Cornea, 2017; 36(11); 1408-14
6. Moulton EA, Becerra L, Rosenthal P, An approach to localizing corneal pain representation in human primary somatosensory cortex: PLoS One, 2012; 7(9); e44643
7. Han SB, Yang HK, Hyon JY, Association of dry eye disease with psychiatric or neurological disorders in elderly patients: Clin Interv Aging, 2017; 12; 785-92
8. Braden JB, Zhang L, Zimmerman FJ, Employment outcomes of persons with a mental disorder and comorbid chronic pain: Psychiatr Serv, 2008; 59(8); 878-85
9. Naushad N, Dunn LB, Muñoz RF, Depression increases subjective stigma of chronic pain: J Affect Disord, 2018; 229; 456-62
10. Dai XJ, Liu CL, Zhou RL, Long-term total sleep deprivation decreases the default spontaneous activity and connectivity pattern in healthy male subjects: A resting-state fMRI study: Neuropsychiatr Dis Treat, 2015; 11; 761-72
11. Qiao PF, Gao PY, Dai JP, Research progress on resting state fMRI of epilepsy: Brain Dev, 2012; 34(1); 8-12
12. Guo Z, Liu X, Hou H, Abnormal degree centrality in Alzheimer’s disease patients with depression: A resting-state functional magnetic resonance imaging study: Exp Gerontol, 2016; 79; 61-66
13. Chen C, Wang HL, Wu SH, Abnormal degree centrality of bilateral putamen and left superior frontal gyrus in schizophrenia with auditory hallucinations: A resting-state functional magnetic resonance imaging study: Chin Med J (Engl), 2015; 128(23); 3178-84
14. An L, Cao QJ, Sui MQ, Local synchronization and amplitude of the fluctuation of spontaneous brain activity in attention-deficit/hyperactivity disorder: A resting-state fMRI study: Neurosci Bull, 2013; 29(5); 603-13
15. Zuo XN, Ehmke R, Mennes M, Network centrality in the human functional connectome: Cereb Cortex, 2012; 22(8); 1862-75
16. Wu GR, Stramaglia S, Chen H, Mapping the voxel-wise effective connectome in resting state FMRI: PLoS One, 2013; 8(9); e73670
17. Cai F, Gao L, Gong H, Network centrality of resting-state fMRI in primary angle-closure glaucoma before and after surgery: PLoS One, 2015; 10(10); e141389
18. Zuo XN, Ehmke R, Mennes M, Network centrality in the human functional connectome: Cereb Cortex, 2012; 22(8); 1862-75
19. Belmonte C, Acosta MC, Merayo-Lloves J, What causes eye pain?: Curr Ophthalmol Rep, 2015; 3(2); 111-21
20. Szatmary G, Neuroimaging in the diagnostic evaluation of eye pain: Curr Pain Headache Rep, 2016; 20(9); 52
21. Goyal S, Hamrah P, Understanding neuropathic corneal pain – gaps and current therapeutic approaches: Semin Ophthalmol, 2016; 31(1–2); 59-70
22. Pessoa L, Hof PR, From Paul Broca’s great limbic lobe to the limbic system: J Comp Neurol, 2015; 523(17); 2495-500
23. Brown S, Yuan Y, Broca’s area is jointly activated during speech and gesture production: Neuroreport, 2018; 29(14); 1214-16
24. Kotter R, Meyer N, The limbic system: A review of its empirical foundation: Behav Brain Res, 1992; 52(2); 105-27
25. Enatsu R, Gonzalez-Martinez J, Bulacio J, Connections of the limbic network: A corticocortical evoked potentials study: Cortex, 2015; 62; 20-33
26. Lovblad KO, Schaller K, Vargas MI, The fornix and limbic system: Semin Ultrasound CT MR, 2014; 35(5); 459-73
27. Aoki S, Sato Y, Yanagihara D, Effect of inactivation of the intermediate cerebellum on over ground locomotion in the rat: A comparative study of the anterior and posterior lobes: Neurosci Lett, 2014; 576; 22-27
28. Herzfeld DJ, Kojima Y, Soetedjo R, Encoding of action by the Purkinje cells of the cerebellum: Nature, 2015; 526(7573); 439-42
29. Ramirez-Zamora A, Zeigler W, Desai N, Treatable causes of cerebellar ataxia: Mov Disord, 2015; 30(5); 614-23
30. Edamatsu M, Miyano R, Fujikawa A, Hapln4/Bral2 is a selective regulator for formation and transmission of GABAergic synapses between Purkinje and deep cerebellar nuclei neurons: J Neurochem, 2018; 147; 748-63
31. Kolb B, Gibb R, Searching for the principles of brain plasticity and behavior: Cortex, 2014; 58; 251-60
32. Gross CG, Single neuron studies of inferior temporal cortex: Neuropsychologia, 2008; 46(3); 841-52
33. Denys K, Vanduffel W, Fize D, The processing of visual shape in the cerebral cortex of human and nonhuman primates: A functional magnetic resonance imaging study: J Neurosci, 2004; 24(10); 2551-65
34. Meadows JC, The anatomical basis of prosopagnosia: J Neurol Neurosurg Psychiat, 1974; 37(5); 489-501
35. Radua J, Phillips ML, Russell T, Neural response to specific components of fearful faces in healthy and schizophrenic adults: Neuroimage, 2010; 49(1); 939-46
36. Chou TL, Chen CW, The role of inferior frontal gyrus and inferior parietal lobule in semantic processing of Chinese characters: Exp Brain Res, 2009; 198; 465-75
37. Wu SS, Chang TT, Majid A, Functional heterogeneity of inferior parietal cortex during mathematical cognition assessed with cytoarchitectonic probability maps: Cereb Cortex, 2009; 19(12); 2930-45
38. Ardila A, A proposed reinterpretation of Gerstmann’s syndrome: Arch Clin Neuropsychol, 2014; 29(8); 828-33
39. Torrey EF, Schizophrenia and the inferior parietal lobule: Schizophr Res, 2007; 97(1–3); 215-25
40. Bhojraj TS, Francis AN, Montrose DM, Grey matter and cognitive deficits in young relatives of schizophrenia patients: Neuroimage, 2011; 54(Suppl 1); S287-92
41. Foundas AL, Apraxia: Neural mechanisms and functional recovery: Handb Clin Neurol, 2013; 110; 335-45
42. Fukutake T, Apraxia of tool use: An autopsy case of biparietal infarction: Eur Neurol, 2003; 49(1); 45-52
43. Sliwinska MW, James A, Devlin JT, Inferior parietal lobule contributions to visual word recognition: J Cogn Neurosci, 2015; 27(3); 593-604
44. Pereira-Pedro AS, Rilling JK, Chen X, Midsagittal brain variation among non-human primates: Insights into evolutionary expansion of the human precuneus: Brain Behav Evol, 2017; 90(3); 255-63
45. Jones R, Bhattacharya J, A role for the precuneus in thought-action fusion: evidence from participants with significant obsessive-compulsive symptoms: Neuroimage Clin, 2013; 4; 112-21
46. van den Heuvel OA, Remijnse PL, Mataix-Cols D, The major symptom dimensions of obsessive-compulsive disorder are mediated by partially distinct neural systems: Brain, 2009; 132(Pt 4); 853-68
47. Zhuo CJ, Zhu JJ, Wang CL, Increased local spontaneous neural activity in the left precuneus specific to auditory verbal hallucinations of schizophrenia: Chin Med J (Engl), 2016; 129(7); 809-13
48. Maarouf CL, Kokjohn TA, Walker DG, Biochemical assessment of precuneus and posterior cingulate gyrus in the context of brain aging and Alzheimer’s disease: PLoS One, 2014; 9(8); e105784
49. Ashizuka A, Mima T, Sawamoto N, Functional relevance of the precuneus in verbal politeness: Neurosci Res, 2015; 91; 48-56
50. Kitada R, Sasaki AT, Okamoto Y, Role of the precuneus in the detection of incongruency between tactile and visual texture information: A functional MRI study: Neuropsychologia, 2014; 64; 252-62
51. Wang H, Chen T, Ye L, Network centrality in patients with acute unilateral open globe injury: A voxel-wise degree centrality study: Mol Med Rep, 2017; 16(6); 8295-300
52. Tan G, Dan ZR, Zhang Y, Altered brain network centrality in patients with adult comitant exotropia strabismus: A resting-state fMRI study: J Int Med Res, 2018; 46(1); 392-402
53. Hu YX, He JR, Yang B, Abnormal resting-state functional network centrality in patients with high myopia: Evidence from a voxel-wise degree centrality analysis: Int J Ophthalmol, 2018; 11(11); 1814-20
54. Zhu PW, Chen Y, Gong YX, Altered brain network centrality in patients with trigeminal neuralgia: A resting-state fMRI study: Acta Radiol, 2020; 61(1); 67-75
55. Wang Y, Jiang L, Wang XY, Evidence of altered brain network centrality in patients with diabetic nephropathy and retinopathy: An fMRI study using a voxel-wise degree centrality approach: Ther Adv Endocrinol Metab, 2019; 10; 2042018819865723
56. Liu WF, Shu YQ, Zhu PW, The cerebellum posterior lobe associates with the exophthalmos of primary hyperthyroidism: A resting-state fMRI study: Int J Endocrinol, 2019; 20191; 8135671
57. Huang X, Zhou FQ, Hu YX, Altered spontaneous brain activity pattern in patients with high myopia using amplitude of low-frequency fluctuation: A resting-state fMRI study: Neuropsychiatr Dis Treat, 2016; 12; 2949-56
Figures
Figure 1. (A) Voxel comparison of degree centrality (DC) in the eye pain (EP) and healthy control (HC) groups: significant differences in DC were observed in the left limbic lobe, right cerebellum posterior lobe, left cerebellum posterior lobe, left inferior temporal gyrus, left inferior parietal lobule, and left precuneus. The red area indicates a higher DC value and the blue color indicates a lower DC value. Multiple comparisons were performed using Gaussian random field theory (z>2.3, column by column correction, P<0.05), P<0.05. (B) Average DC values between EP and HC groups. DC – degree centrality; EP – eye pain; HC – healthy control; L – left; R – right; RCPL – right cerebellum posterior lobe; LCPL – left cerebellum posterior lobe; LLL – left limbic lobe; LITG – left inferior temporal gyrus; LIPL – left inferior parietal lobe; LP – left precuneus.Figure 2. Receiver operating characteristic curve analysis of the mean DC values for altered brain regions. (A) The area under the receiver operating characteristic (ROC) curve were 0.770 for right cerebellum posterior lobe (RCPL) (P<0.001; 95% confidence interval [CI]: 0.668–0.873); left cerebellum posterior lobe (LCPL) 0.767 (P<0.001; 95%CI: 0.663–0.870); left inferior temporal gyrus (LITG) 0.796 (P<0.001; 95%CI: 0.699–0.893); left inferior parietal lobe (LIPL) 0.783 (P<0.001; 95%CI: 0.683–0.883); and left precuneus (LP) 0.749 (p<0.001; 95%CI: 0.642–0.855). (B) The area under the ROC curve (AUC) was 0.749 (P<0.001; 95%CI: 0.644–0.854) for the left limbic lobe (LLL).Figure 3. The correlation of visual analog scale, hospital anxiety and depression scale, and signal value in different brain regions. (A) The visual analog scale (VAS) value of the eyes of the eye pain (EP) group showed a negative correlation with the signal value of the left limbic lobe (r=−0.789, P=0.001). (B) The VAS value of the eyes of the EP group showed a positive correlation with the signal value of the left inferior parietal lobule (r=0.561, P=0.046). (C) The HADS value of the eyes of the EP group showed a negative correlation with the signal value of the left limbic lobe (r=−0.837; P=0.001).Figure 4. The degree centrality results of brain activity in the eye pain (EP) group. Compared with the healthy control (HC) group, the DC of patients in the EP group in the following regions were elevated: 1, left precuneus (t=3.6715); 2, left inferior parietal lobule (t=3.8899); 3, left inferior temporal gyrus (t=3.7357); 4, left cerebellum posterior lobe (t=4.5262); and 5, right cerebellum posterior lobe (t=4.4116). Region 6, the left limbic lobe (t=−3.5969), was decreased. The sizes of the spots denote the degree of quantitative changes. Tables
Table 1. Information on resting-state functional magnetic resonance imaging parameters.Table 2. Demographics and clinical measurements.Table 3. Significant differences in degree centrality between different brain regions of eye pain and healthy control groups.Table 4. Brain regions alternations and potential impact.Table 5. DC method applied in ophthalmological diseases.Table 1. Information on resting-state functional magnetic resonance imaging parameters.Table 2. Demographics and clinical measurements.Table 3. Significant differences in degree centrality between different brain regions of eye pain and healthy control groups.Table 4. Brain regions alternations and potential impact.Table 5. DC method applied in ophthalmological diseases. In Press
06 Mar 2024 : Clinical Research
Prevalence and Variation of Medical Comorbidities in Oral Surgery Patients: A Retrospective Study at Jazan ...Med Sci Monit In Press; DOI: 10.12659/MSM.943884
08 Mar 2024 : Clinical Research
Evaluation of Foot Structure in Preschool Children Based on Body MassMed Sci Monit In Press; DOI: 10.12659/MSM.943765
15 Apr 2024 : Laboratory Research
The Role of Copper-Induced M2 Macrophage Polarization in Protecting Cartilage Matrix in OsteoarthritisMed Sci Monit In Press; DOI: 10.12659/MSM.943738
07 Mar 2024 : Clinical Research
Knowledge of and Attitudes Toward Clinical Trials: A Questionnaire-Based Study of 179 Male Third- and Fourt...Med Sci Monit In Press; DOI: 10.12659/MSM.943468
Most Viewed Current Articles
17 Jan 2024 : Review article
Vaccination Guidelines for Pregnant Women: Addressing COVID-19 and the Omicron VariantDOI :10.12659/MSM.942799
Med Sci Monit 2024; 30:e942799
14 Dec 2022 : Clinical Research
Prevalence and Variability of Allergen-Specific Immunoglobulin E in Patients with Elevated Tryptase LevelsDOI :10.12659/MSM.937990
Med Sci Monit 2022; 28:e937990
16 May 2023 : Clinical Research
Electrophysiological Testing for an Auditory Processing Disorder and Reading Performance in 54 School Stude...DOI :10.12659/MSM.940387
Med Sci Monit 2023; 29:e940387
01 Jan 2022 : Editorial
Editorial: Current Status of Oral Antiviral Drug Treatments for SARS-CoV-2 Infection in Non-Hospitalized Pa...DOI :10.12659/MSM.935952
Med Sci Monit 2022; 28:e935952