30 October 2021: Database Analysis
Construction and Verification of a Hypoxia-Stemness-Based Gene Signature for Risk Stratification in Esophageal Cancer
Kang Tang 1BCDE , Yong Cheng 2AF , Qian Li 3AF*DOI: 10.12659/MSM.934359
Med Sci Monit 2021; 27:e934359
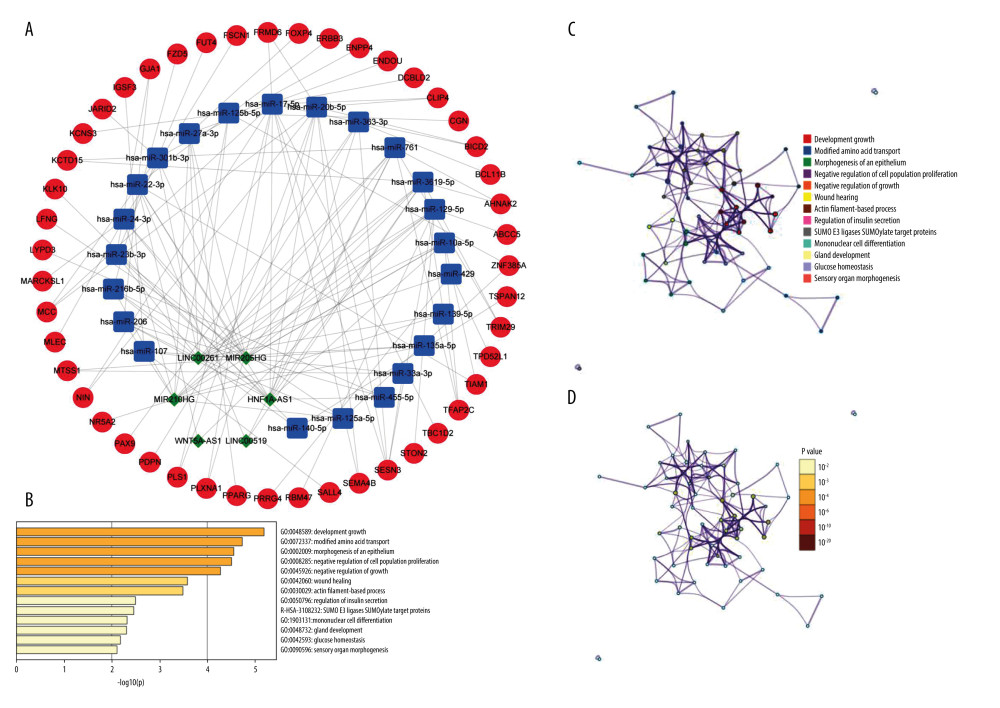
Figure 7 Construction of prognostic model-related ceRNA networks(A) The ceRNA network of differential mRNAs (red) and their target miRNAs (blue) and lncRNAs (green) between high- and low-risk groups. (B) Heat map of enriched terms for 47 mRNAs, the top 13 clusters, and their representative enriched terms (1 for each cluster). Color scale represents the significance of the P value. (C, D) Network of enriched terms. Colored by cluster ID (C), where nodes with the same cluster ID are usually close to each other; Colored by P value (D), where terms containing more genes tend to have more significant P values.