30 October 2021: Database Analysis
Construction and Verification of a Hypoxia-Stemness-Based Gene Signature for Risk Stratification in Esophageal Cancer
Kang Tang 1BCDE , Yong Cheng 2AF , Qian Li 3AF*DOI: 10.12659/MSM.934359
Med Sci Monit 2021; 27:e934359
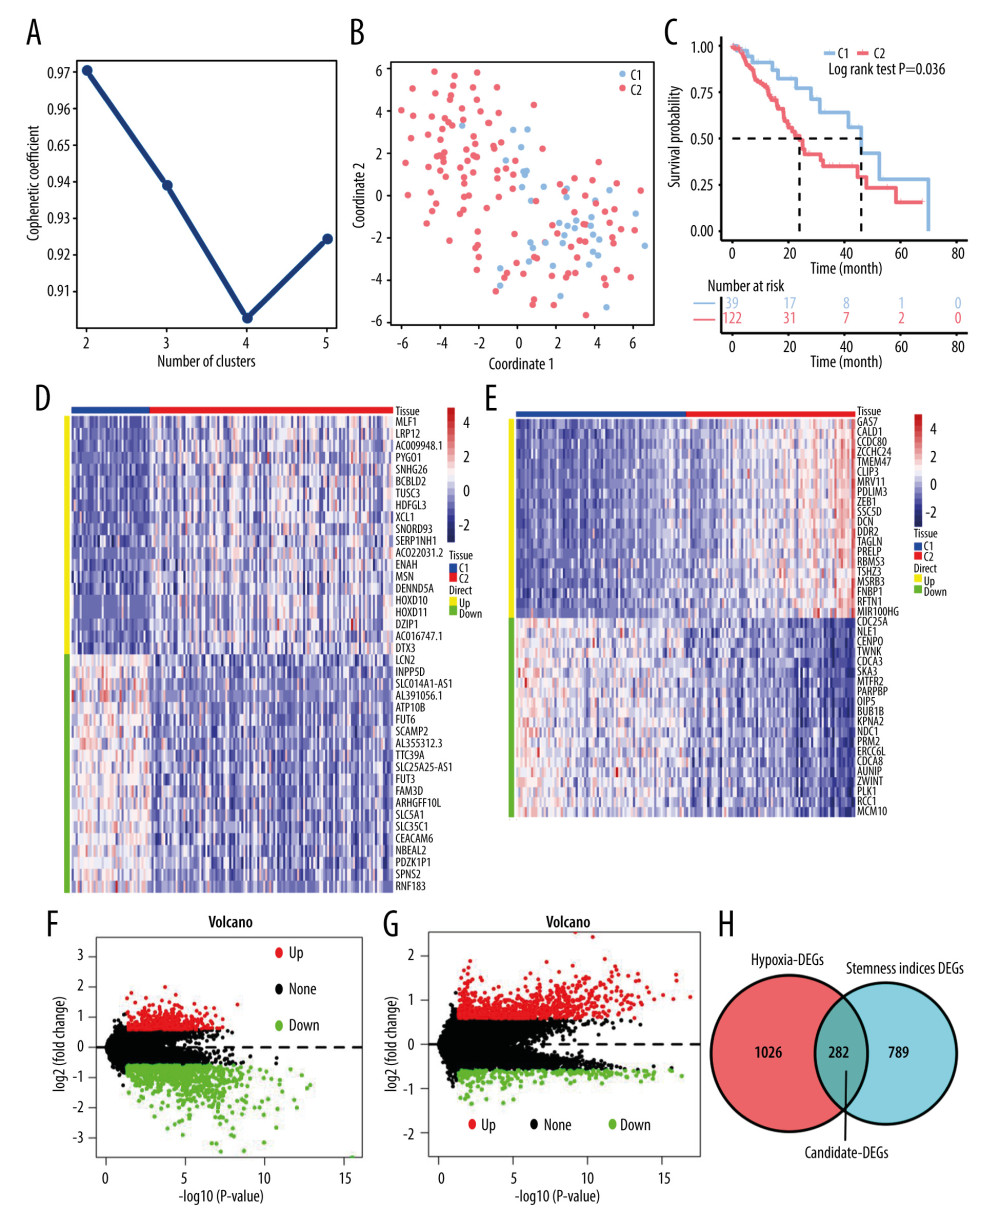
Figure 1 Identification of hypoxia- and stemness-related DEGs(A) Cophenetic coefficient for clusters k=2 to 5. The figure shows that the most significant cointegration correlation coefficient occurs in cluster k=2. (B) Scatter plots of 2 different clusters identified by the t-SNE algorithm based on 469 hypoxic candidate genes. (C) Kaplan-Meier plots of overall survival for 2 hypoxia subgroups of ESCA patients. (D) Heat map showing the expression of hypoxia-associated DEGs and comparison between ESCA subgroups based on hypoxia. (E) Heatmap showing expression profiles for stemness-related DEGs with the comparison between ESCA subgroups according to the median of stemness index. (F) Volcano plot of hypoxia-associated DEGs gene expression. (G) Volcano plot of stemness-associated DEGs gene expression. (H) Venn diagrams show overlaps of hypoxia-related DEGs with stemness-related DEGs.