01 January 2022: Clinical Research
A Statistical Prediction Model for Survival After Kidney Transplantation from Deceased Donors
Jia-shan Pan AE* , Yi-ding Chen BC* , Han-dong Ding B , Tian-chi Lan B , Fei Zhang B , Jin-biao Zhong A* , Gui-yi Liao AF*DOI: 10.12659/MSM.933559
Med Sci Monit 2022; 28:e933559
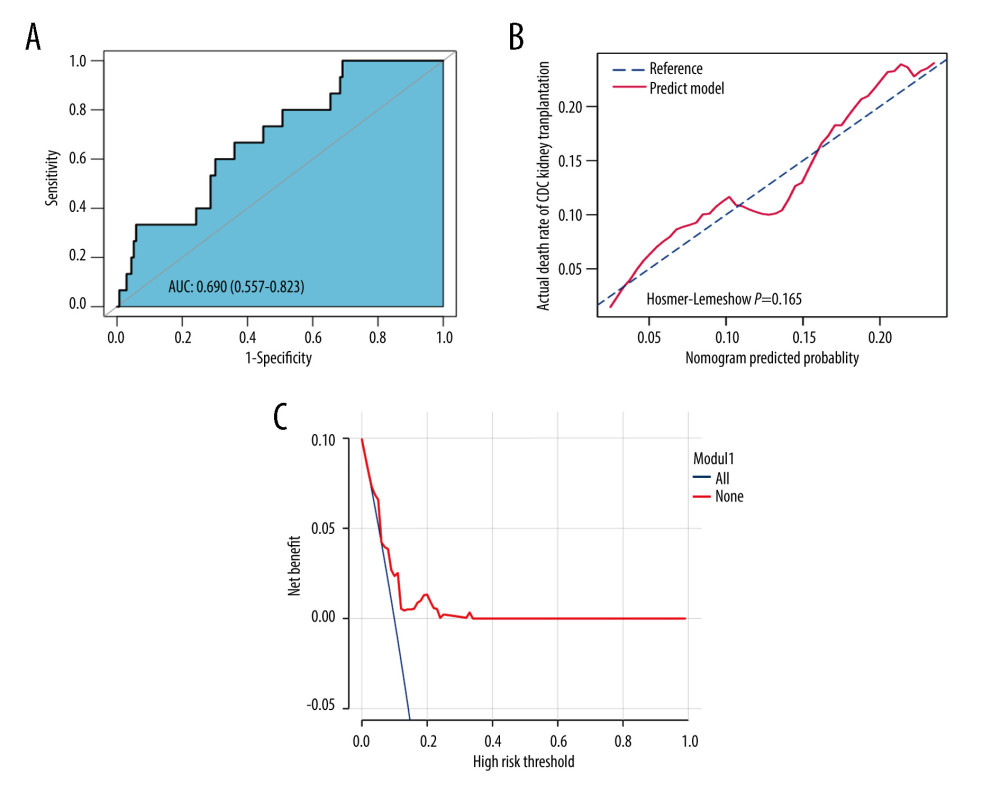
Figure 4 Assessment of the clinical effectiveness of the proposed model.(A) Receiver operating characteristic (ROC) curves of the nomogram of the post-KT mortality risk prediction. The x-axis and y-axis represent the false-positive and true-positive rates of the post-KT mortality risk prediction. The area under the ROC curve (AUC) is 0.690. (B) Calibration curves of the nomogram of the post-KT mortality risk prediction for the study cohort. The x-axis represents the post-KT death predictions, while the y-axis represents the actual death outcomes. The diagonal dotted line corresponds to perfect prediction outcomes by an ideal model. The solid line represents the nomogram performance, where a closer fit to the diagonal dotted line represents better prediction. (C) Decision curve analysis (DCA) for post-KT death. The y-axis measures the net benefit. The red line represents the nomogram of the post-KT death risk. The thin solid line represents the assumption of survival of all kidney recipients after kidney transplantation, while the thick solid line represents the assumption of the death of all kidney recipients after kidney transplantation. The decision curve shows that if the threshold probabilities of a patient and a doctor are (>0.02) and (<0.24), respectively, using the mortality risk nomogram in the current study for post-KT mortality risk prediction is more beneficial than the intervention-for-all-recipients scheme or the no-intervention scheme. The figures use R software (version 4.0.3; https://www.R-project.org).