24 January 2022: Clinical Research
Correlation Between Severity of Illness and Levels of Free Triiodothyronine, Interleukin-6, and Interleukin-10 in Patients with Acute Pancreatitis
Fei Tian ABCDEFG , Tianjiao Lin ABCDEF , Qingyun Zhu ABC , Youdong Wan ABC , Ziqian Wu C , Shaoyan Lv C , Jingyu Song C , Ruomeng Li BE , Yunyun Wang E , Yushi Zhang D , Xu Yan E , Xinting Pan ABCDEFG*DOI: 10.12659/MSM.933230
Med Sci Monit 2022; 28:e933230
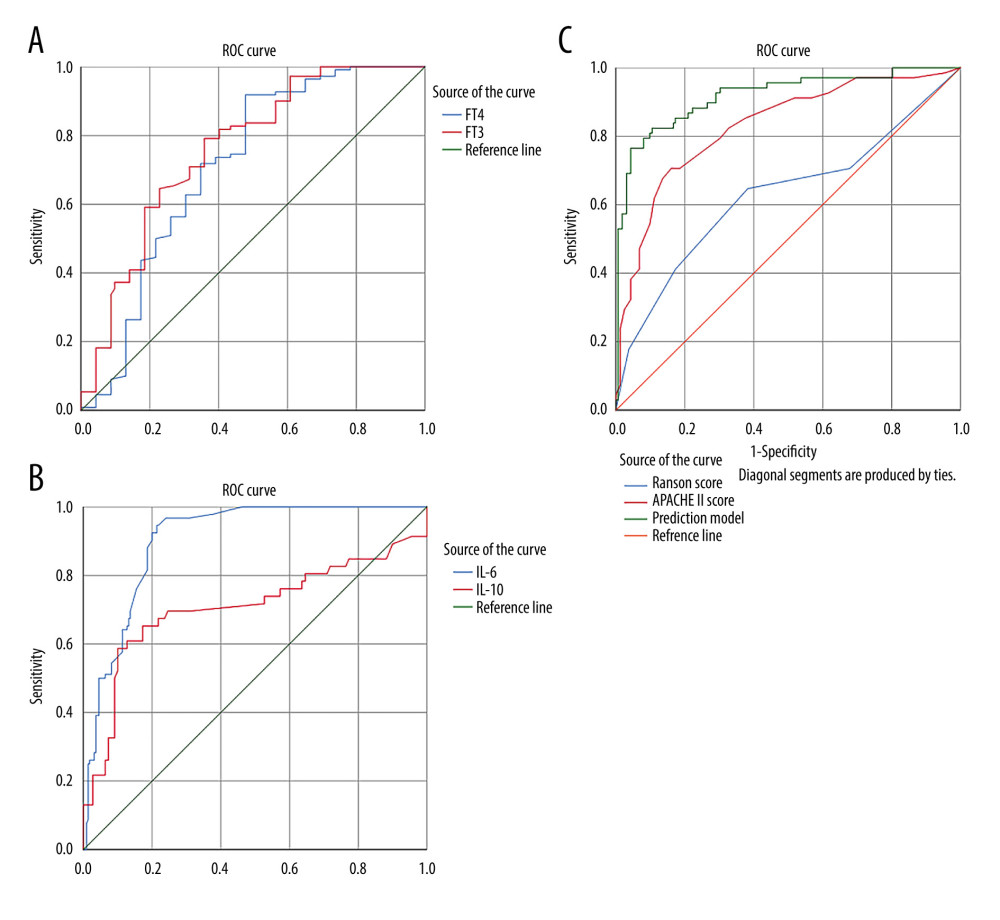
Figure 2 ROC curves of thyroid and other parameters for predicting AP prognosis. Panel A is the comparison between ROC curve of FT3 and that of FT4. Panel B is the ROC curve comparison of IL-6 and IL-10. Panel C is ROC curve analysis of the prediction model composed of Ranson score, APACHE II score. (SPSS: Statistical Product and Service Solutions, SPSS 26.0, IBM; PS: Photoshop, Photoshop CC, Adobe systems).