12 August 2021: Clinical Research
Renal Cortical Perfusion Estimated in Color Doppler Dynamic Tissue Perfusion Measurement in Patients Treated with Levothyroxine Following Total Thyroidectomy for Resectable Thyroid Cancer Is Independently Associated with Free Thyroxine: A Single-Center Prospective Study
Arkadiusz Lubas 1ABCDEF* , Anna Grzywacz 1DEF , Stanisław Niemczyk 1BEG , Grzegorz Kamiński 2ABE , Marek Saracyn 2ABDEFDOI: 10.12659/MSM.932096
Med Sci Monit 2021; 27:e932096
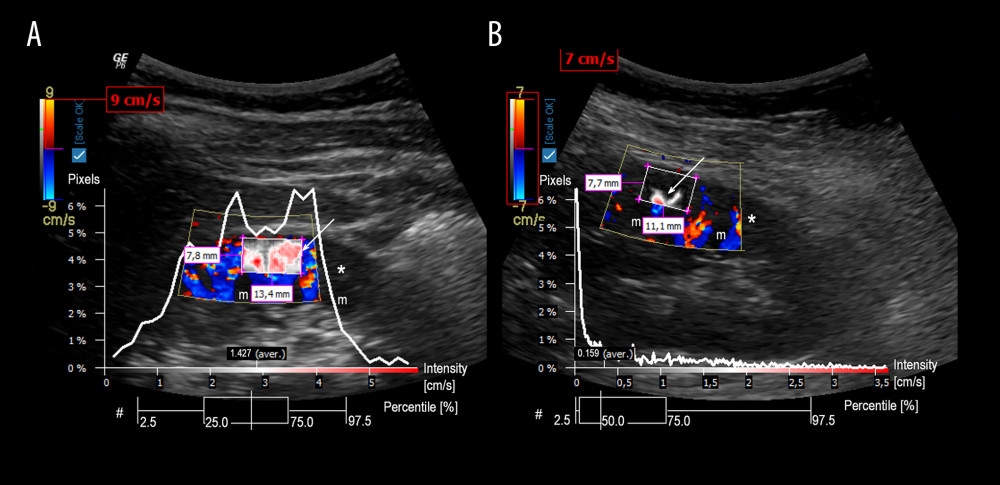
Figure 3 Graphical presentation of the ultrasound examinations and analyses of renal cortical perfusion in the 2 patients with different free thyroxine concentrations. Graphics present the perfusion relief (white arrow) and the perfusion intensity (white curve) assessment in the renal cortex. A diagram Pixels/Intensity is a quantitative evaluation of RCP showing how many pixels within the investigated region of interest are related to the intensity of the respective value. A box-plot diagram (#) expresses the distribution of pixel perfusion intensity, in percentiles (whisker: 2.5% and 97.5%; box 25% and 75%; vertical line in the box 50% – median). A – examination of a patient with FT4 25.93 pmol/L and RCP 1.427 cm/s; B – examination of a patient with FT4 14.77 pmol/L and RCP 0.159 cm/s; * – renal cortex; m – renal medulla.