16 June 2021: Review Articles
Current Applications and Selected Technical Details of Dual-Energy X-Ray Absorptiometry
Piotr Sawicki 1ABCDEF* , Marek Tałałaj 2D , Katarzyna Życińska 13DEG , Wojciech S. Zgliczyński 4DFG , Waldemar Wierzba 56DEFGDOI: 10.12659/MSM.930839
Med Sci Monit 2021; 27:e930839
Background
Importance of the DXA in Diagnostics of BMD
Safety Considerations Regarding Radiation Dose
DXA Diagnosis of Vertebral Fractures Using VFA
Visualization of Abdominal Aortic Calcifications (AAC)
Evaluation of Hip Structure Analysis (HSA)
Diagnosis of Atypical Femur Fracture (AFF)
Evaluation of Finite Element Analysis (FEA)
Evaluation of FRAX
Definition and Importance of TBS
Body Composition Assessment
Evaluation of Periprosthetic DXA
Other Functions
Conclusions
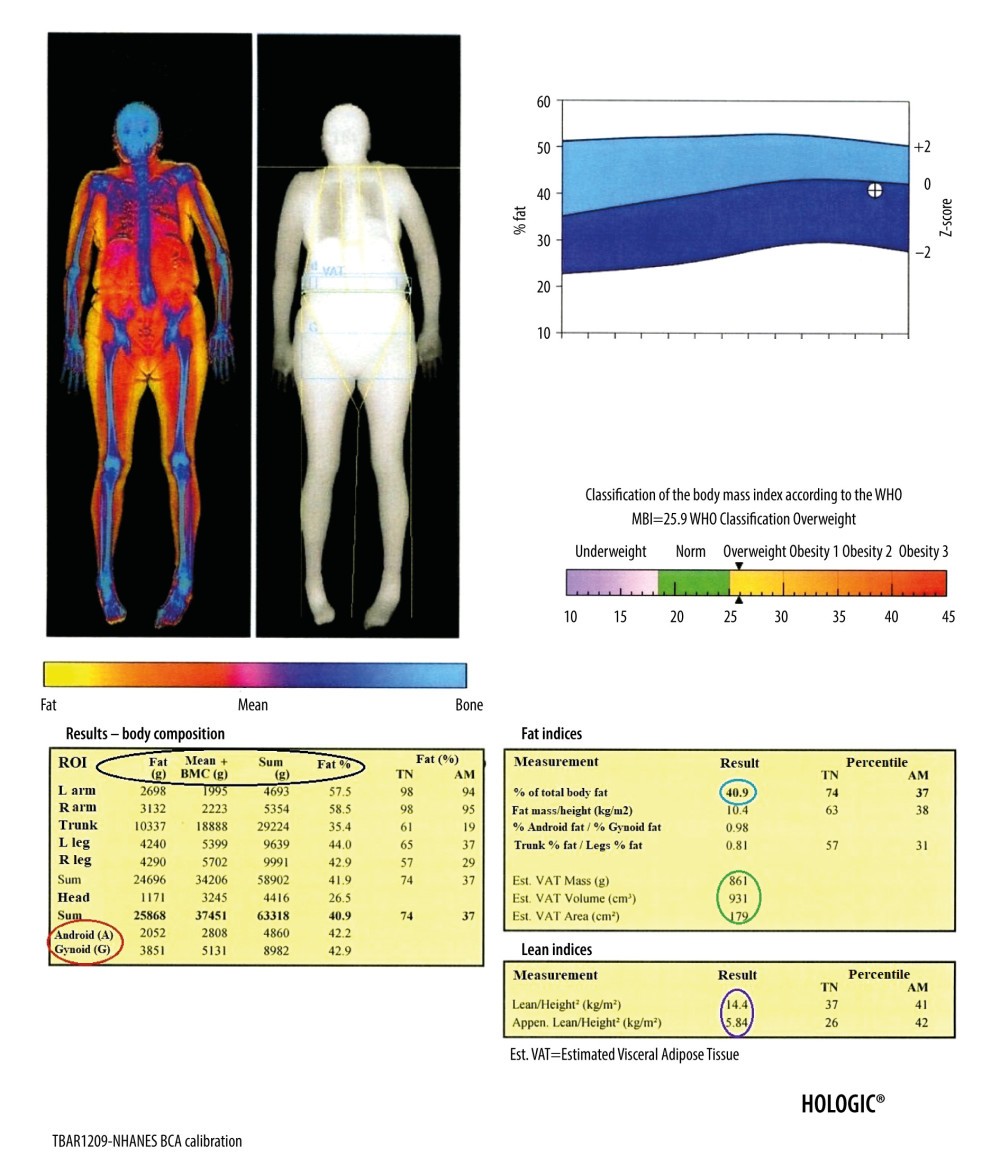
Figure 7 Result of the body composition assessment – soft tissues. The table on the left shows (parameters from the left, marked in the black circle, respectively): the mass of adipose tissue, the sum of the mass of other soft tissues and bone tissue, the total mass, and the percentage of fat tissue in individual ROIs, including the android and gynoid region (A and G in red circle, respectively). In the tables on the right are presented, among others: percentage of total body fat mass (blue circle), parameters of visceral adipose tissue (green circle), and parameters useful in the assessment of loss of muscle mass (purple circle).