11 June 2021: Animal Study
Protective Effects of Bone Marrow Mesenchymal Stem Cells (BMMSCS) Combined with Normothermic Machine Perfusion on Liver Grafts Donated After Circulatory Death via Reducing the Ferroptosis of Hepatocytes
Dong Sun 1BCDEF* , Liu Yang 1BCEF* , Weiping Zheng 23CE , Huan Cao 14BD , Longlong Wu 5DF , Hongli Song 26AG*DOI: 10.12659/MSM.930258
Med Sci Monit 2021; 27:e930258
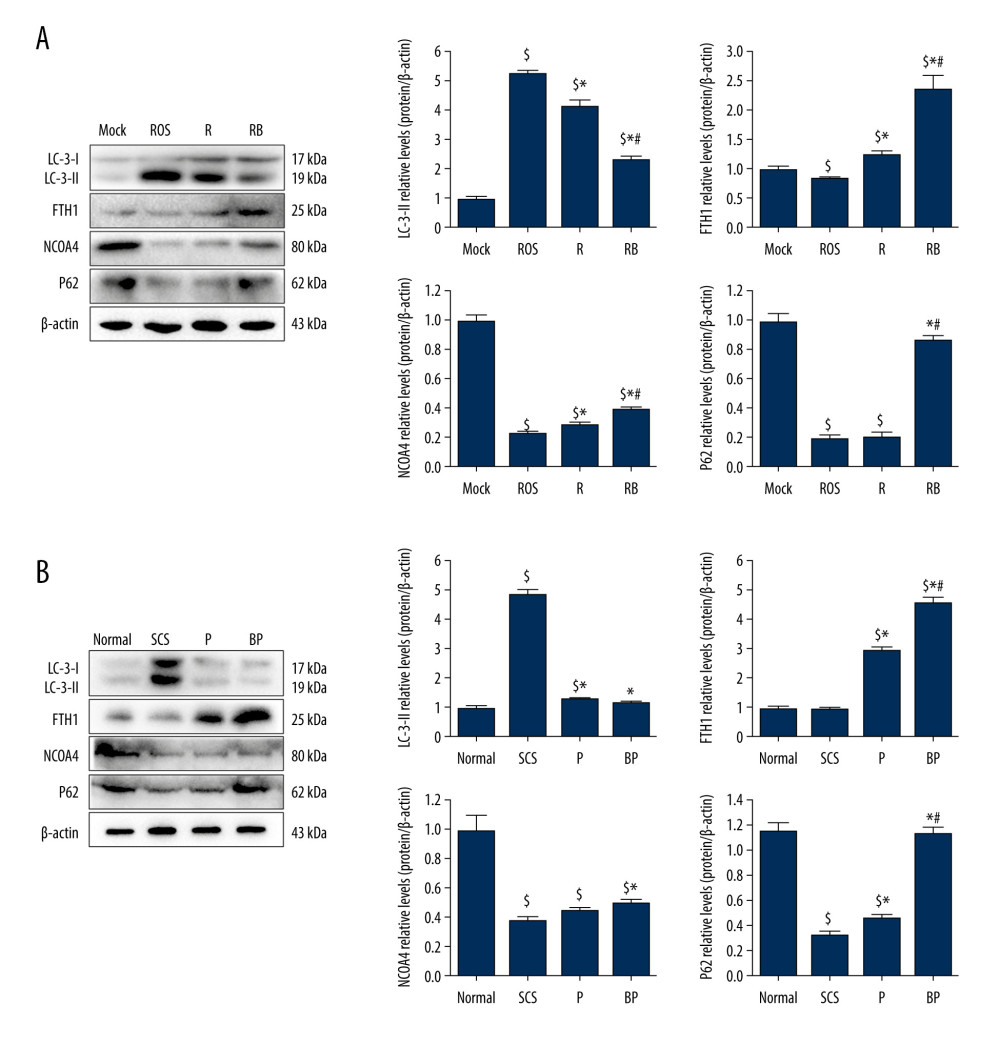
Figure 6 Decreased autophagy and increased expression of ferritinophagy-related proteins in IAR-20 cells co-cultured with BMMSCs. (A) Western blot of LC-3, FTH1, NCOA4 and P62 in IAR-20 cells of different groups. Expression level of LC-3-II in the RB group was significantly lower than that in the R group and ROS group (ROS group vs Mock group, P<0.001; R group vs Mock group, P<0.001; R group vs ROS group, P=0.005; RB group vs Mock group, P<0.001; RB group vs ROS group, P<0.001; RB group vs R group, P=0.001). Expression level of FTH1 in the RB group was significantly higher than that in the R group and ROS group (ROS group vs Mock group, P=0.040; R group vs Mock group, P=0.014; R group vs ROS group, P=0.003; RB group vs Mock group, P=0.003; RB group vs ROS group, P=0.002; RB group vs R group, P=0.005). Expression level of NCOA4 in the RB group was significantly lower than that in the R group and ROS group (ROS group vs Mock group, P<0.001; R group vs Mock group, P<0.001; R group vs ROS group, P=0.013; RB group vs Mock group, P<0.001; RB group vs ROS group, P<0.001; RB group vs R group, P=0.002). Expression level of P62 in the RB group was significantly lower than that in the R group and ROS group (ROS group vs Mock group, P<0.001; R group vs Mock group, P<0.001; R group vs ROS group, P=0.863; RB group vs Mock group, P=0.081; RB group vs ROS group, P<0.001; RB group vs R group, P<0.001). $ P<0.05 vs the Mock group, * P<0.05 vs the ROS group, # P<0.05 vs the R group. (B) Western blot of LC-3, FTH1, NCOA4 and P62 in liver tissues of different groups. Expression level of LC-3-II in the BP group was significantly lower than that in the SCS group (SCS group vs Normal group, P<0.001; P group vs Normal group, P=0.017; P group vs SCS group, P<0.001; BP group vs Normal group, P=0.124; BP group vs SCS group, P<0.001; BP group vs P group, P=0.172). Expression level of FTH1 in the BP group was significantly higher than that in the P group and SCS group (SCS group vs Normal group, P=0.602; P group vs Normal group, P<0.001; P group vs SCS group, P<0.001; BP group vs Normal group, P<0.001; BP group vs SCS group, P<0.001; BP group vs P group, P=0.001). Expression level of NCOA4 in the BP group was significantly higher than that in the SCS group (SCS group vs Normal group, P<0.001; P group vs Normal group, P<0.001; P group vs SCS group, P=0.054; BP group vs Normal group, P<0.001; BP group vs SCS group, P=0.004; BP group vs P group, P=0.055). Expression level of P62 in the BP group was significantly higher than that in the P group and SCS group (SCS group vs Normal group, P<0.001; P group vs Normal group, P<0.001; P group vs SCS group, P=0.005; BP group vs Normal group, P=0.062; BP group vs SCS group, P<0.001; BP group vs P group, P<0.001). $ P<0.05 vs the Normal group, * P<0.05 vs the SCS group, # P<0.05 vs the P group. SCS – static cold storage; P – NMP; BP – BMMSCs combined with NMP; NMP – normothermic machine perfusion; BMMSCs – bone marrow mesenchymal stem cells; ROS – reactive oxygen species; LC-3 – light Chain 3; FTH1 – ferritin heavy chain; NCOA4 – nuclear receptor co-activator 4; P62 – sequestosome 1/p62.