10 May 2021: Clinical Research
Functional Magnetic Resonance Imaging of Language Following Constraint-Induced Aphasia Therapy Primed with Intermittent Theta Burst Stimulation in 13 Patients with Post-Stroke Aphasia
Jane B. Allendorfer 1BCDEF* , Rodolphe Nenert 1BCDE , Sangeeta Nair 1CDE , Jennifer Vannest 2ABDE , Jerzy P. Szaflarski 13ABCDEFGDOI: 10.12659/MSM.930100
Med Sci Monit 2021; 27:e930100
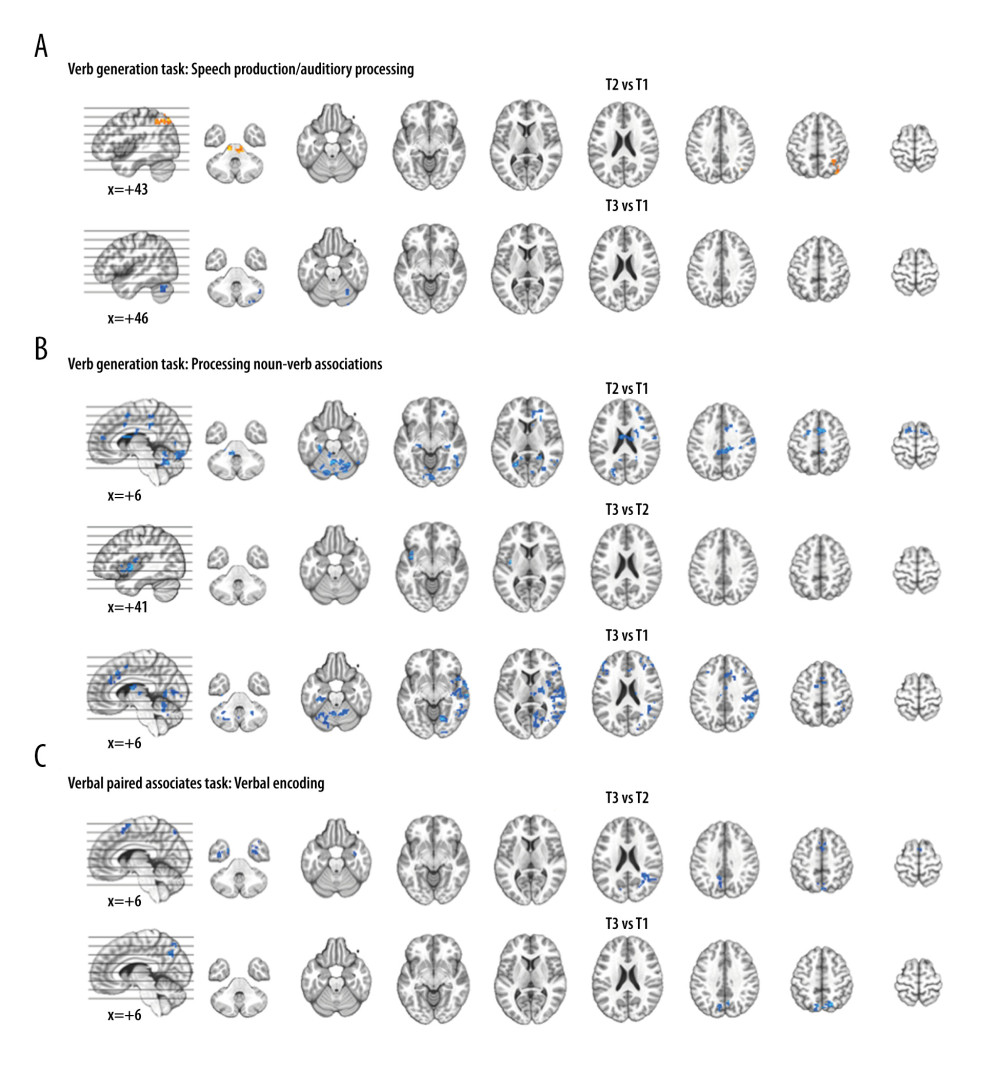
Figure 4 Functional magnetic resonance imaging (fMRI) statistical maps showing changes in activation over time. Paired t-tests reveal differences in fMRI activation between the 3 visits for the verb generation and verbal paired associates tasks. Coordinates of peak activation differences and extent of brain regions are provided in Table 3. Comparisons of immediately post-treatment relative to baseline (T2 vs T1) included 13 participants, while comparisons of 3-month follow-up relative to either immediately post-treatment (T3 vs T2) or to baseline (T3 vs T1) included 12 participants. The fMRI statistical maps are overlaid onto a standard anatomical brain image in Montreal Neurologic Institute space. For all axial slices, left in the image is left in the brain. (A) Regions showing differences in activation for speech production/auditory processing (“say verbs” vs “think verbs”) between T2 and T1 are shown in orange in the right angular gyrus and midbrain. There were also differences in activation between T3 and T1 in the right cerebellum (in blue). Clusters showing differences over time are significant at p<0.05, corrected (voxelwise p=0.05, cluster threshold of 2079 mm3). (B) T1 compared to both T2 and T3 showed differences in activation for processing noun-verb semantic associations (“say verbs” vs “repeat nouns”) as shown in blue in a number of regions including the cerebellum, as well as frontal, temporal, and parietal regions. The only activation difference for T3 relative to T2 is in the left insula (in blue). Activations are significant at p<0.05, corrected (voxelwise p=0.05, cluster threshold of 2079 mm3). (C) The differences in activation for verbal encoding at T3 relative to both T2 and T1 were in visual and parietal regions (in blue). Differences in activation between T3 and T2 also include bilateral temporal pole and midline frontal regions. Activations are significant at p<0.05, corrected (voxelwise p=0.05, cluster threshold of 1836 mm3).