12 February 2021: Database Analysis
Development and Validation of a 5-Gene Autophagy-Based Prognostic Index in Endometrial Carcinoma
Xiaoyan Chen 1ABCDFF , Wei Zhang 1BCDE , Haiping Zhu 2EF , Feng Lin 1AEFG*DOI: 10.12659/MSM.928949
Med Sci Monit 2021; 27:e928949
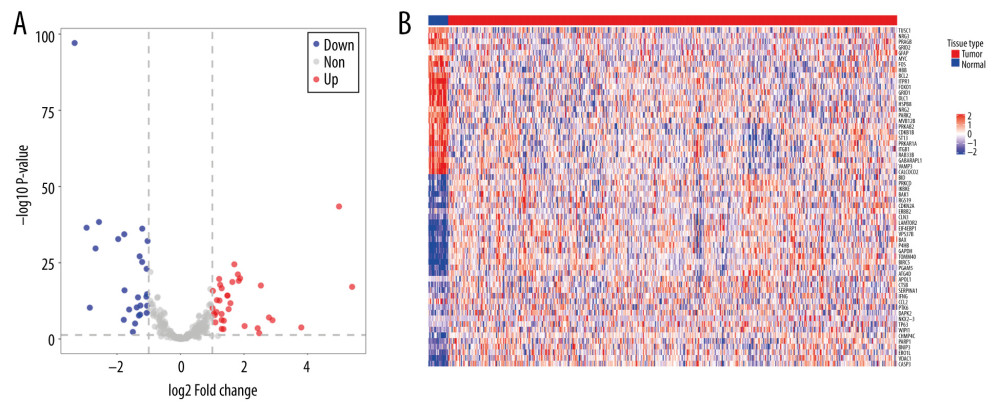
Figure 2 The expression of differential autophagy-related genes (ARGs) in TCGA-UCEC cohort. The expression of differential ARGs between EC tissues (n=523) and normal tissues (n=23) was shown in the plots. (A) In the volcano plot, red dots stand for upregulated ARGs, blue dots stand for downregulated ARGs, and the gray dots stand for the ARGs that were not differentially expressed. (B) The heatmap plot shows ARGs between EC tissues and normal tissues. Red color is upregulated ARGs and blue color is downregulated ARGs.