01 October 2020: Database Analysis
, , and Are Related to Glucocorticoid-Induced Osteoporosis Occurrence According to Integrated Bioinformatics Analysis
Liuxun Li 1ABCDEF , Meiling Yang 2BCDEF , Anmin Jin 1ABCDEFG*DOI: 10.12659/MSM.925474
Med Sci Monit 2020; 26:e925474
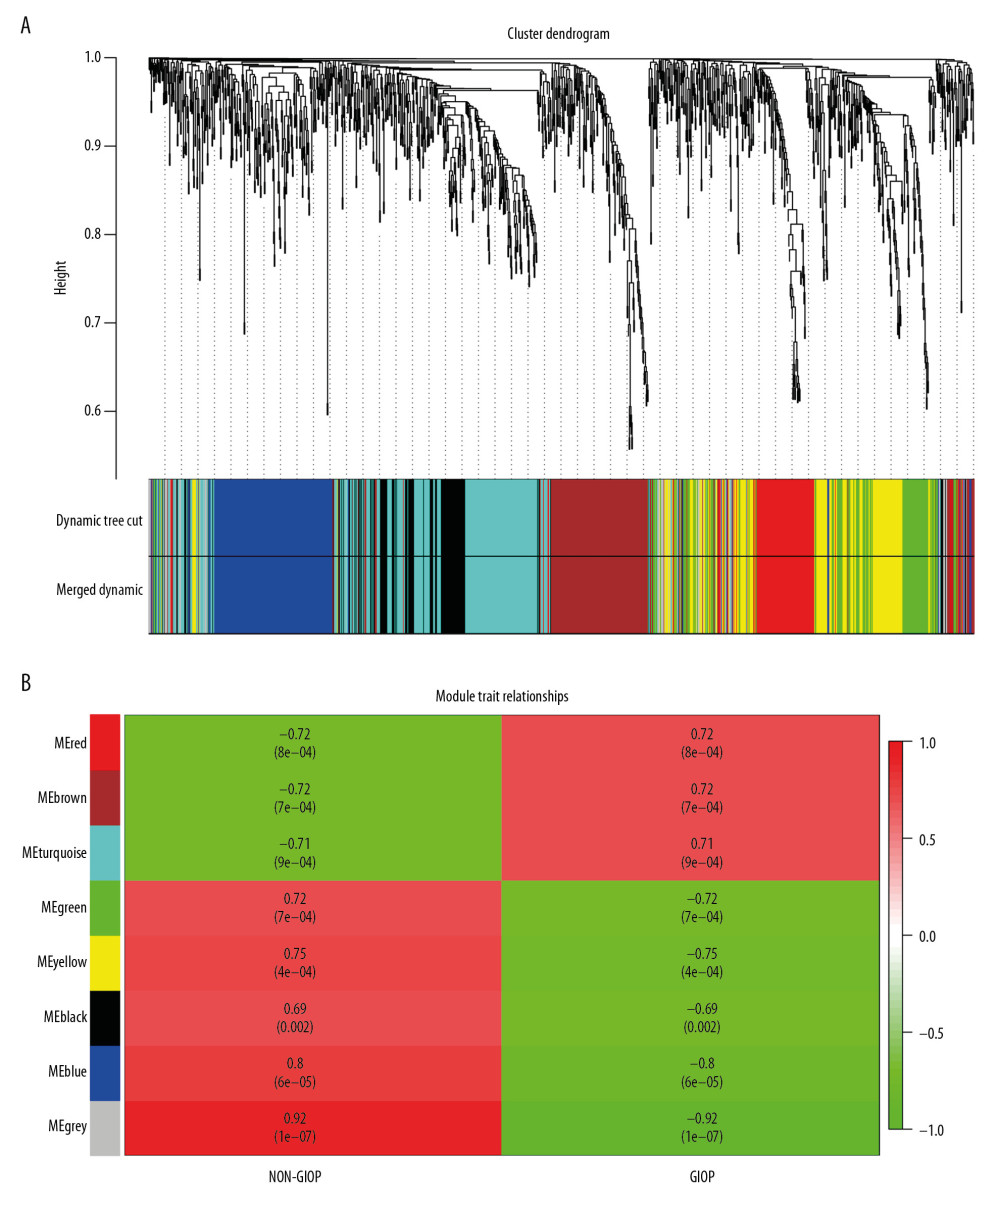
Figure 4 Hub module selection. (A) Dendrogram of all DEGs clustered according to a dissimilarity measure (1-TOM). (B) Heatmap of the relationships of module with the disease traits. In the module, the greater mean gene relevance stands for the greater relationship of this module with the traits of interest. The horizontal and vertical axes stand for clinical factors and modules, respectively. The color gradient from red to green represents the shift from positive to negative correlation. The numbers in grids represent correlation coefficients. Values in parenthesis are the P-values for the association test. The red, brown, and turquoise gene modules are positively related to GIOP status, values in the figure indicate the correlation coefficient between modules and clinical traits. TOM – topological overlap matrix; DEGs – differentially expressed genes; Me – module; GIOP – glucocorticoid-induced osteoporosis.