01 October 2020: Database Analysis
, , and Are Related to Glucocorticoid-Induced Osteoporosis Occurrence According to Integrated Bioinformatics Analysis
Liuxun Li 1ABCDEF , Meiling Yang 2BCDEF , Anmin Jin 1ABCDEFG*DOI: 10.12659/MSM.925474
Med Sci Monit 2020; 26:e925474
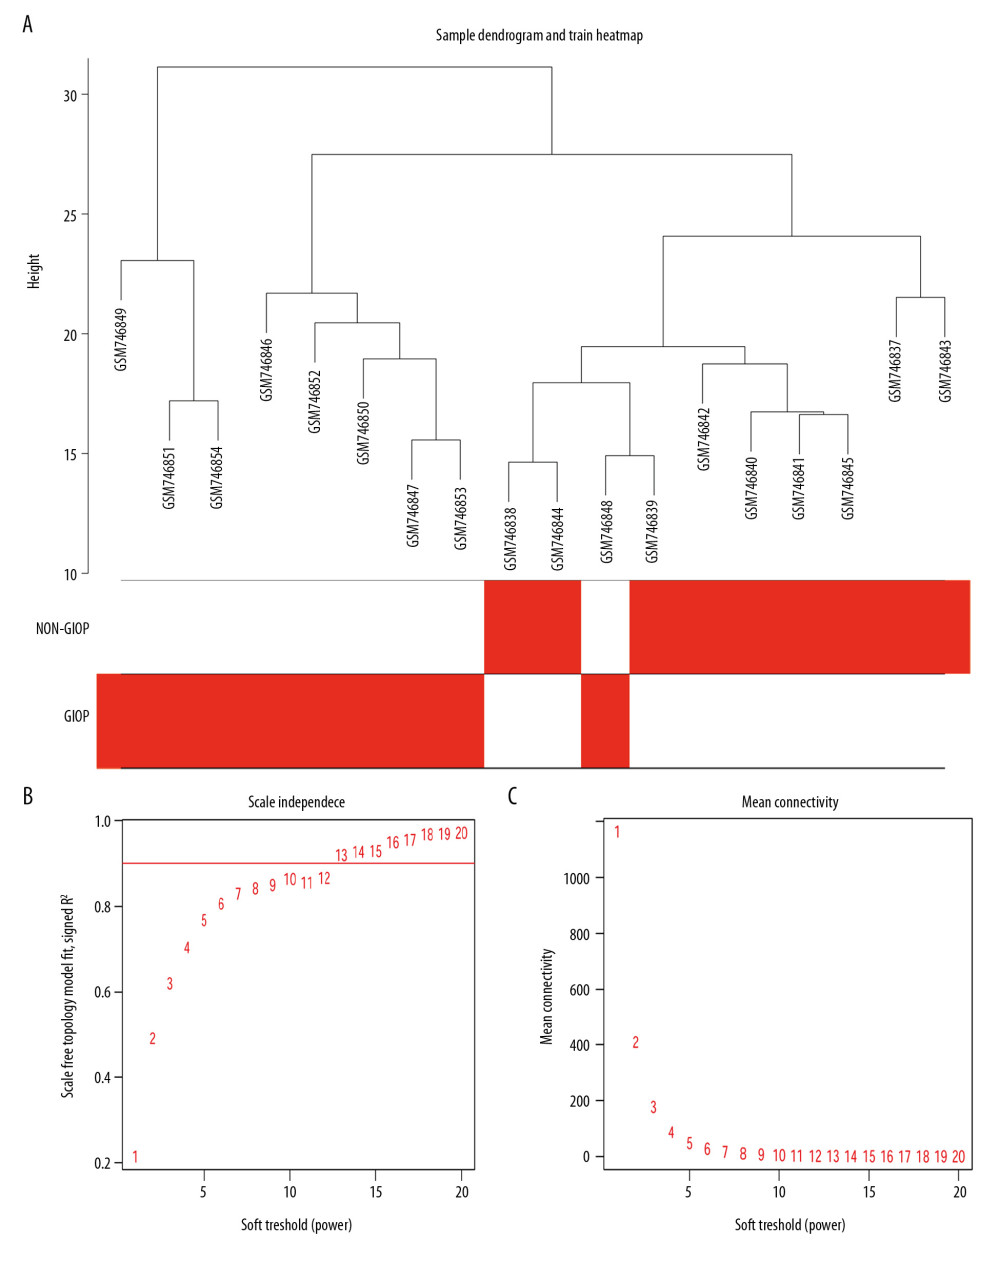
Figure 3 Sample clustering and soft-threshold power determination. (A) Hierarchical clustering dendrogram and the microarray sample trait. GIOP and non-GIOP samples can be classified. (B) Scale-free fit index analyses to determine different soft threshold powers (β). (C) Mean connectivity analyses to determine different soft threshold powers. GIOP – glucocorticoid-induced osteoporosis; WGCNA – weighted gene coexpression network analysis.