01 October 2020: Database Analysis
, , and Are Related to Glucocorticoid-Induced Osteoporosis Occurrence According to Integrated Bioinformatics Analysis
Liuxun Li 1ABCDEF , Meiling Yang 2BCDEF , Anmin Jin 1ABCDEFG*DOI: 10.12659/MSM.925474
Med Sci Monit 2020; 26:e925474
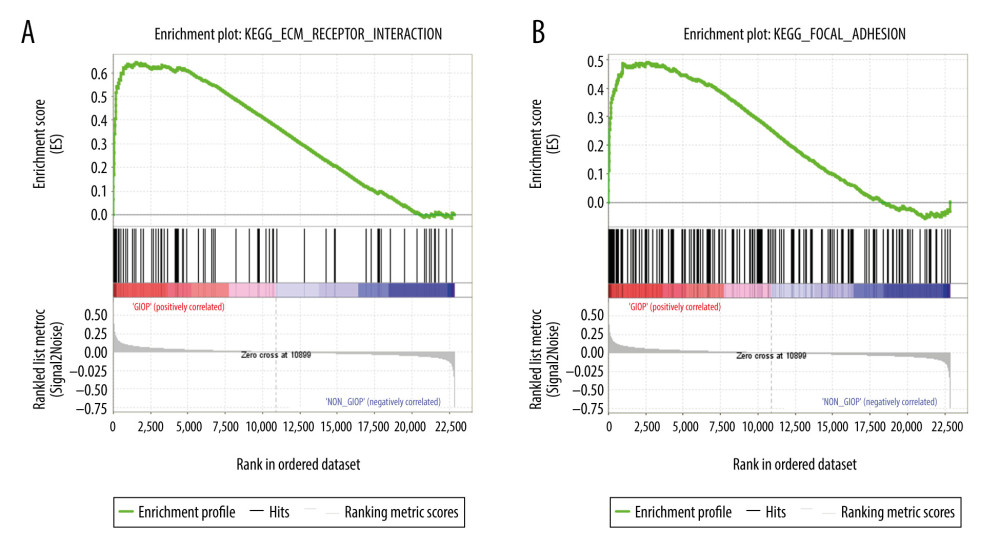
Figure 10 GSEA of GIOP status in the GEO dataset. Two functional gene sets enriched in GIOP status with high expression of hub genes are shown. In the expression heatmap figures, the red color stands for upregulated genes, while the blue color indicates the downregulated genes. (A) ECM receptor interaction (B) Focal adhesion. ECM – extracellular matrix; GSEA – Gene Set Enrichment Analysis; GIOP – glucocorticoid-induced osteoporosis; GEO – Gene Expression Omnibus.