30 September 2020: Clinical Research
Application of a Prediction Model Based on the Laboratory Index Score in Prelabor Rupture of Membranes with Histologic Chorioamnionitis During Late Pregnancy
Yan Ma 1ABCEF* , Yun Xu 1BC* , Lijuan Jiang 2AEG* , Xiaonan Shao 3AEDOI: 10.12659/MSM.924756
Med Sci Monit 2020; 26:e924756
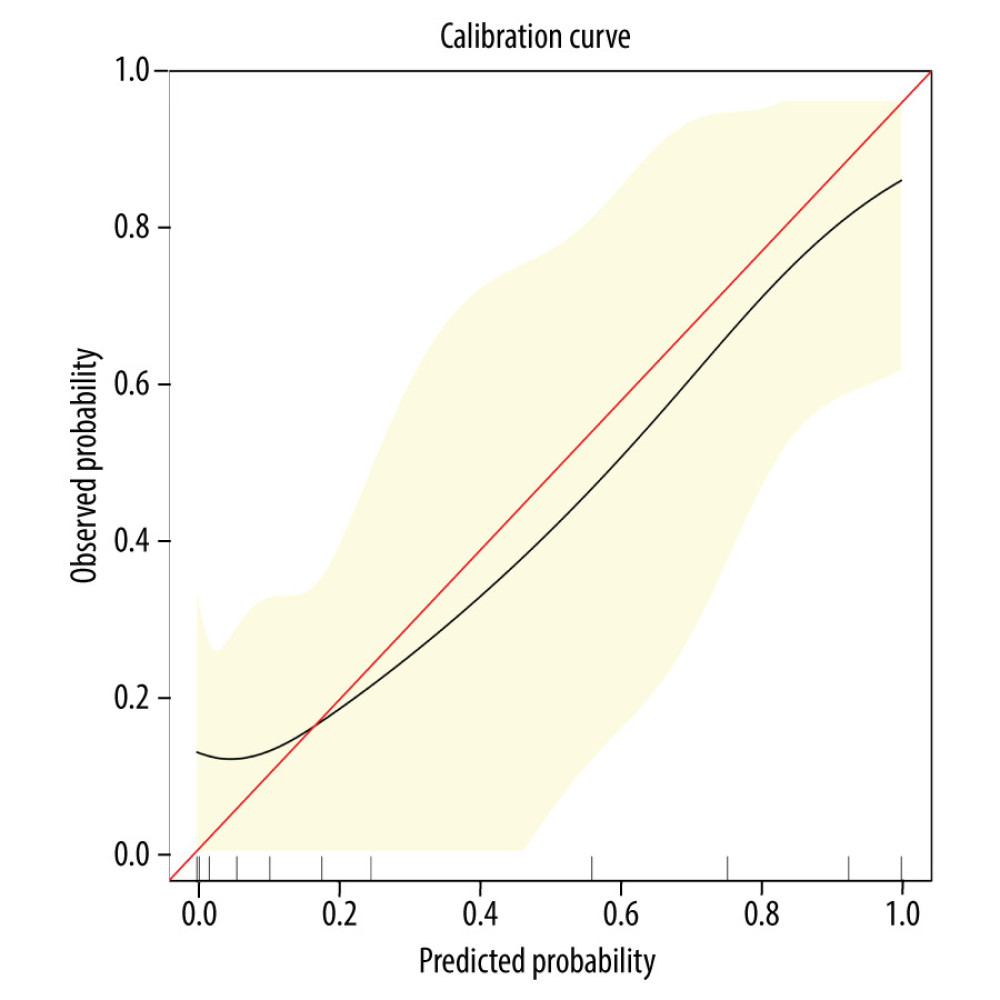
Figure 3 Calibration curve of the nomogram. The horizontal axis is the predicted incidence of histologic chorioamnionitis (HCA). The vertical axis is the observed incidence of HCA. The red diagonal line is the reference line, indicating that the predicted value is equal to the observed value. The black line is the calibration curve, and the yellow areas on both sides represent the 95% confidence interval.