20 October 2020: Clinical Research
Use of Radiomics to Predict Response to Immunotherapy of Malignant Tumors of the Digestive System
Zhi Ji 1BEF* , Yong Cui 2ABC* , Zhi Peng 1DEF* , Jifang Gong 1CE , Hai-tao Zhu 2CD , Xiaotian Zhang 1AE , Jian Li 1CE , Ming Lu 1CF , Zhihao Lu 1AD , Lin Shen 1AFG* , Ying-shi Sun 2AFG*DOI: 10.12659/MSM.924671
Med Sci Monit 2020; 26:e924671
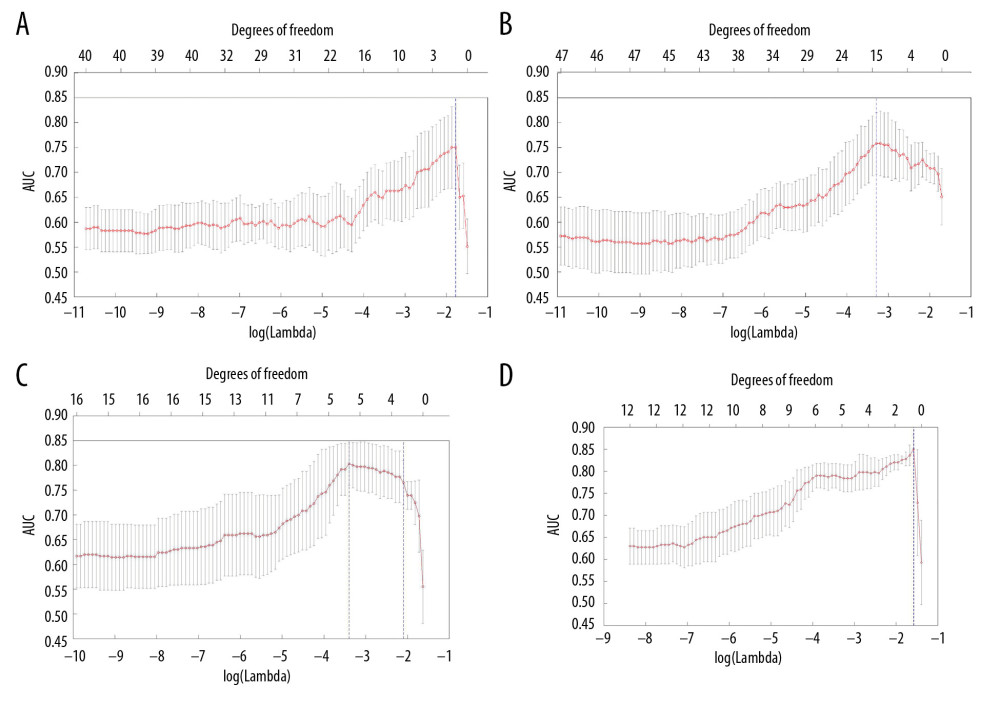
Figure 2 Screening of features using the LASSO method: (A) CT features at baseline; (B) CT features at first evaluation; (C) CT features at baseline and first evaluation; (D) difference between CT features at baseline and at first evaluation. The x-axis shows the parameter λ and the corresponding number of features (degrees of freedom), and the y-axis shows the average AUC values. The dotted line corresponds to λ at the maximum AUC and the number of features.