05 August 2020: Database Analysis
Integrated Analysis of Hub Genes and Pathways In Esophageal Carcinoma Based on NCBI’s Gene Expression Omnibus (GEO) Database: A Bioinformatics Analysis
Tan Yu-jing ACE , Tang Wen-jing C , Tang Biao AEG*DOI: 10.12659/MSM.923934
Med Sci Monit 2020; 26:e923934
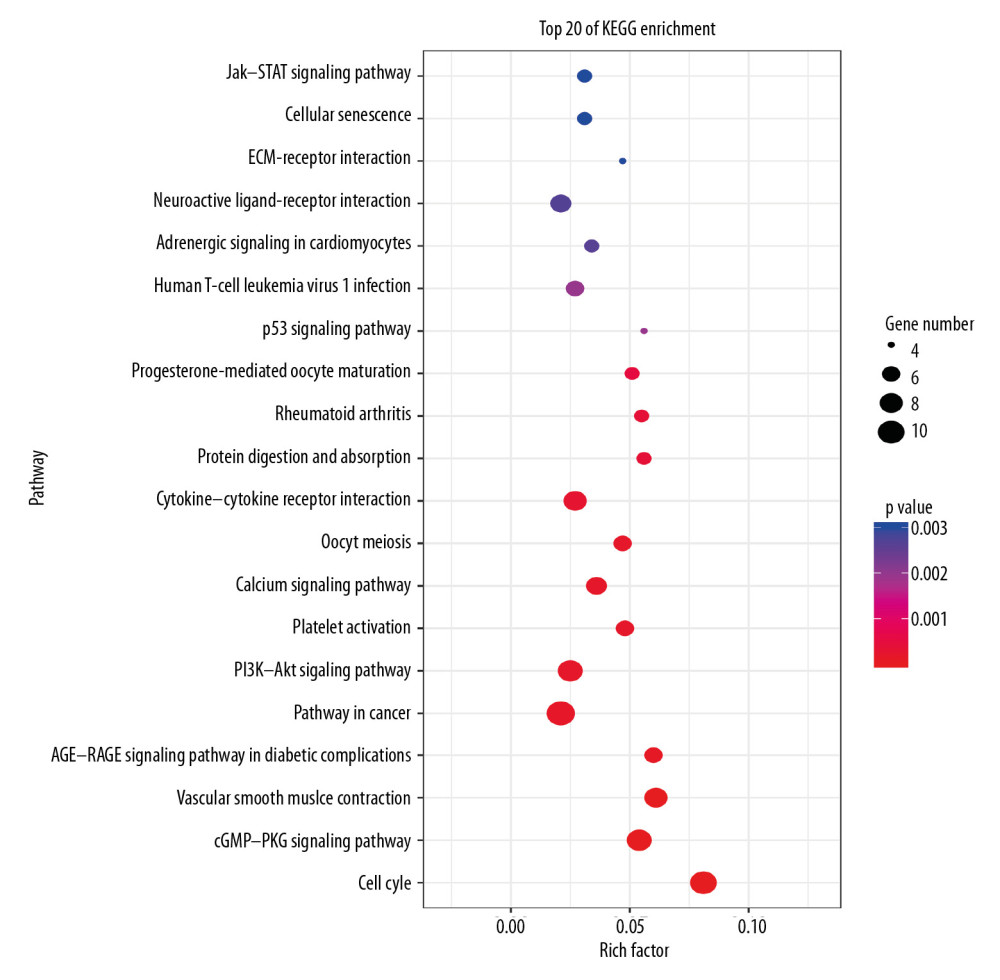
Figure 6 The top 20 KEGG pathways involving the differentially expressed genes (DEGs). Rich factor is represented on the x axis. KEGG pathway annotation is represented on the y axis. The size of the filled circles symbolizes the number of genes involved in the pathways. The color of the filled circles denotes significance, with gradation from red to blue symbolizing increasing p value.