05 August 2020: Database Analysis
Integrated Analysis of Hub Genes and Pathways In Esophageal Carcinoma Based on NCBI’s Gene Expression Omnibus (GEO) Database: A Bioinformatics Analysis
Tan Yu-jing ACE , Tang Wen-jing C , Tang Biao AEG*DOI: 10.12659/MSM.923934
Med Sci Monit 2020; 26:e923934
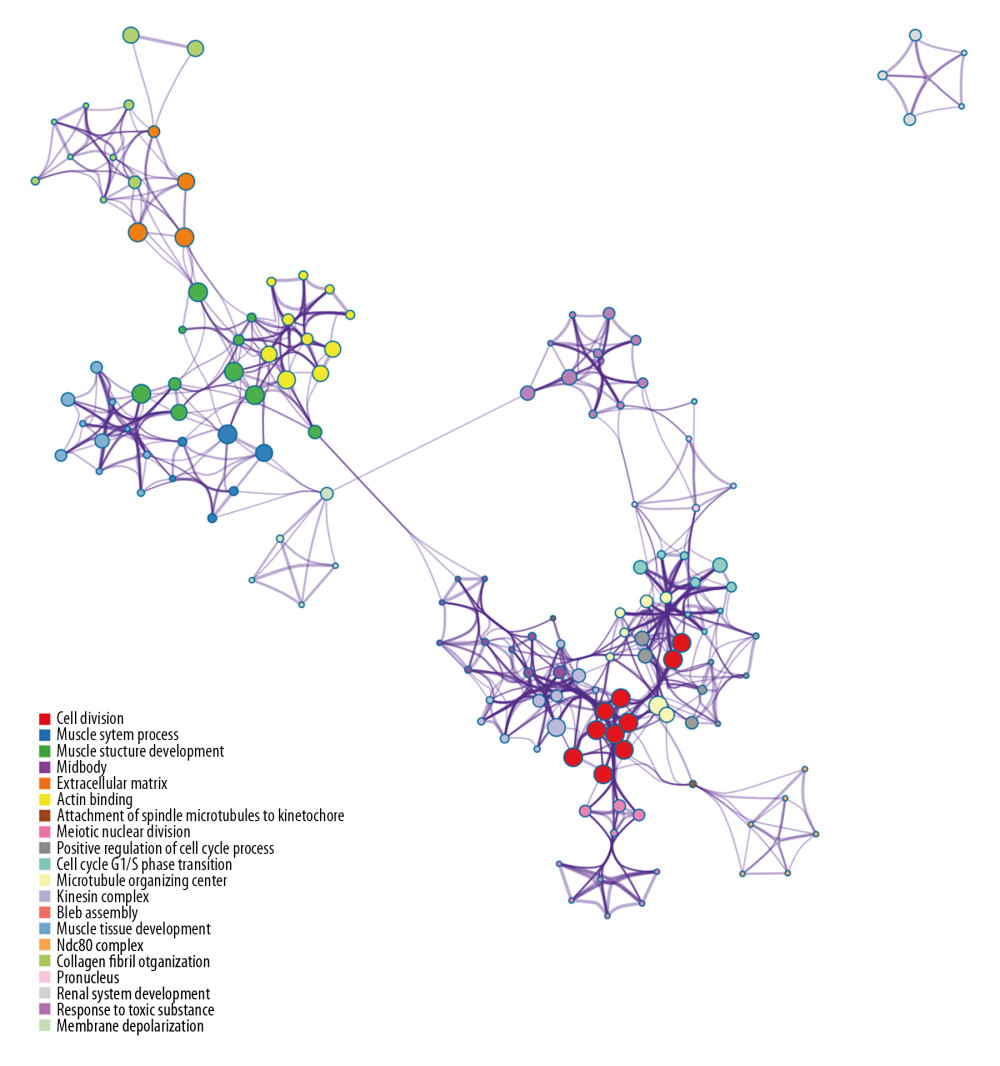
Figure 5 Top 20 results from GO functional enrichment analysis. The size of the filled circles indicates statistical significance. Larger circle size indicates lower p value. Circle color indicates type of GO term, as listed in the legend (lower left corner).