05 August 2020: Database Analysis
Integrated Analysis of Hub Genes and Pathways In Esophageal Carcinoma Based on NCBI’s Gene Expression Omnibus (GEO) Database: A Bioinformatics Analysis
Tan Yu-jing ACE , Tang Wen-jing C , Tang Biao AEG*DOI: 10.12659/MSM.923934
Med Sci Monit 2020; 26:e923934
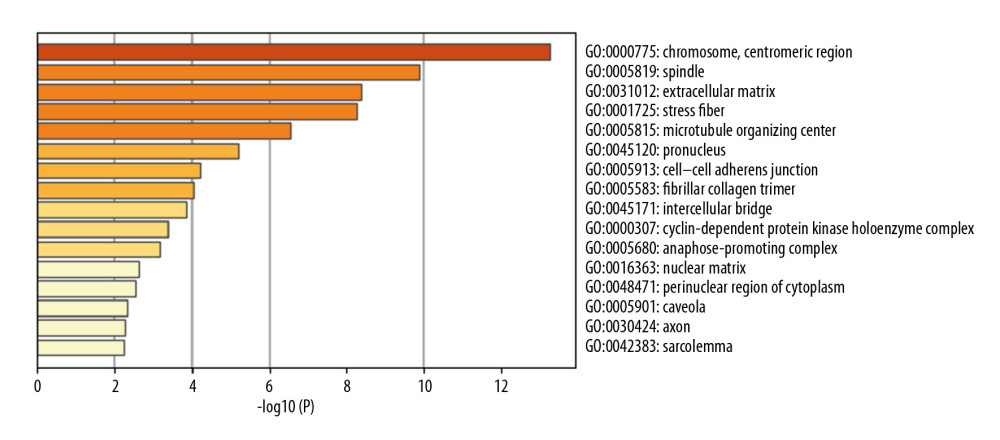
Figure 3 Top 16 enriched cellular component GO terms. The horizontal axis is a logarithmic calculation of p value, while GO terms are listed on the y axis. The length of each bar represents lower p value (higher significance). Chromosome and centromeric region was the term with the highest significance level.