05 August 2020: Database Analysis
Integrated Analysis of Hub Genes and Pathways In Esophageal Carcinoma Based on NCBI’s Gene Expression Omnibus (GEO) Database: A Bioinformatics Analysis
Tan Yu-jing ACE , Tang Wen-jing C , Tang Biao AEG*DOI: 10.12659/MSM.923934
Med Sci Monit 2020; 26:e923934
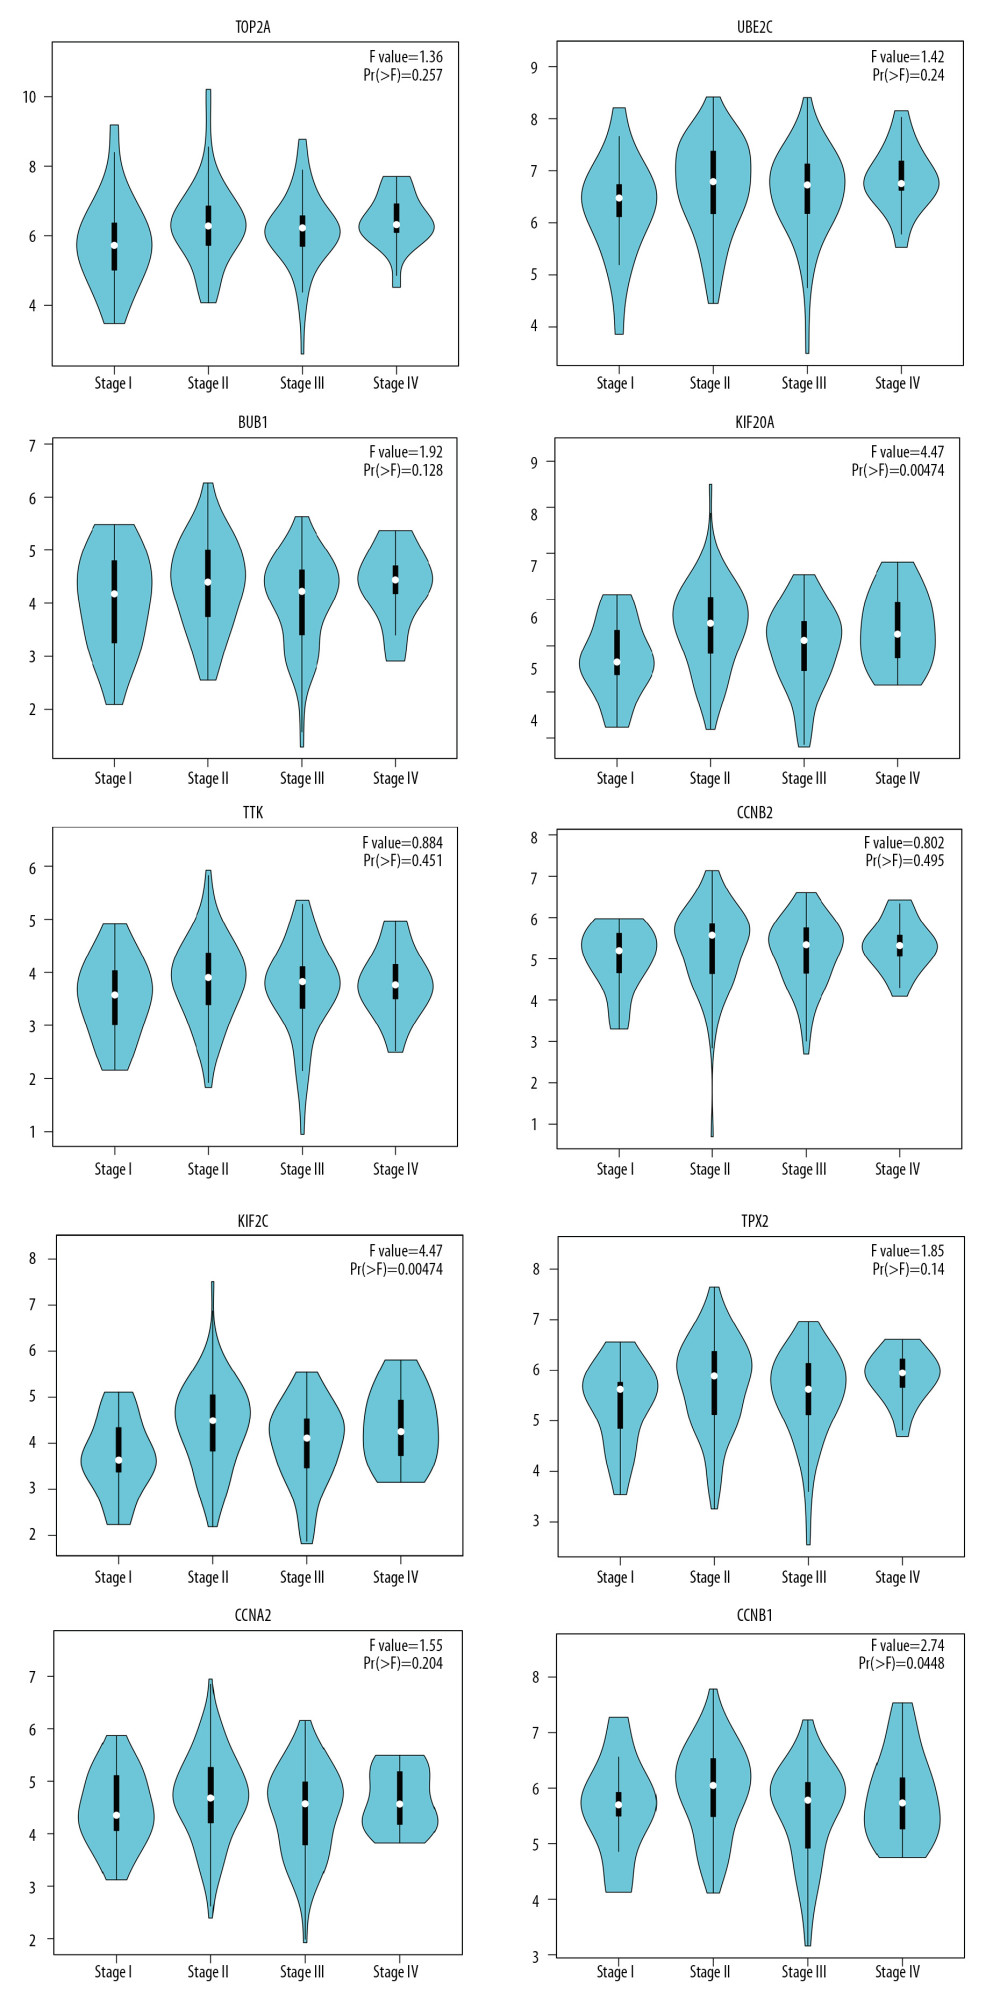
Figure 10 GEPIA stage-plots for the top 10 hub genes in patients at different stages of ESCA. The stage-plot is considered statistically significant when Pr >F. Greater F values represent increasing significance.